IBM Envizi ESG Suite · A guided tour for Maximo people
IBM Envizi in three use cases: from a gas bill to a sustainability disclosure
Maximo knows your assets and TRIRIGA knows your buildings. Neither will tell you how many tonnes of CO2 the company emitted last year, or produce the answer an auditor will accept. That is the job of IBM Envizi. This guide walks through it on IBM's demo organisation in three use cases: build the data foundation, report emissions, and answer a disclosure. Every number comes from the live screens.
- What Envizi is, and how its five menus map to the work of a sustainability team.
- The data model in four words: group, location, account, record.
- Use case 1: the data foundation, down to one natural gas account.
- Use case 2: emissions reporting: Scope 1, 2 and 3, PowerReports, performance against last year.
- Use case 3: disclosures: the Sustainability Reporting Manager and its frameworks.
- What happens next: programs and actions to reduce the number.
Reading time: about 15 minutes. System: IBM Envizi ESG Suite, demo organisation "Demo Corporation US".
| You know (Maximo, TRIRIGA) | In Envizi |
|---|---|
| Site, location, building | Location: a place where data is collected. 662 in the demo. |
| Location hierarchy, classification | Groups: several hierarchies over the same locations (by region, by business group, by portfolio) |
| Meter on an asset | Account (monthly bill-style data) or Meter (interval readings) |
| Meter reading | Record: a quantity, a cost and a period on an account |
| Meter type, unit of measure | Data type and account style: "Natural Gas (GJ)", "Electricity (kWh)" |
| Start Center, KPI | Summary pages and PowerReports (embedded Power BI) |
| Work order, PM, job plan | Program, action plan, action in the Optimize menu |
| Nothing equivalent | Emission factors, kept by Envizi, that turn kWh, litres and dollars into CO2e |
1. What Envizi is
Envizi is a system of record for environmental, social and governance (ESG) data. In plain words it does four things:
- Collects activity data: electricity and gas bills, water, waste, fuel, business travel, purchases.
- Converts it to emissions with emission factors it maintains, and sorts the result into Scope 1, 2 and 3.
- Reports it: internally in dashboards, externally in disclosures such as CDP, GRI, ESRS or TCFD.
- Tracks the reduction: targets, and the programs meant to reach them.
2. Five menus, one working cycle
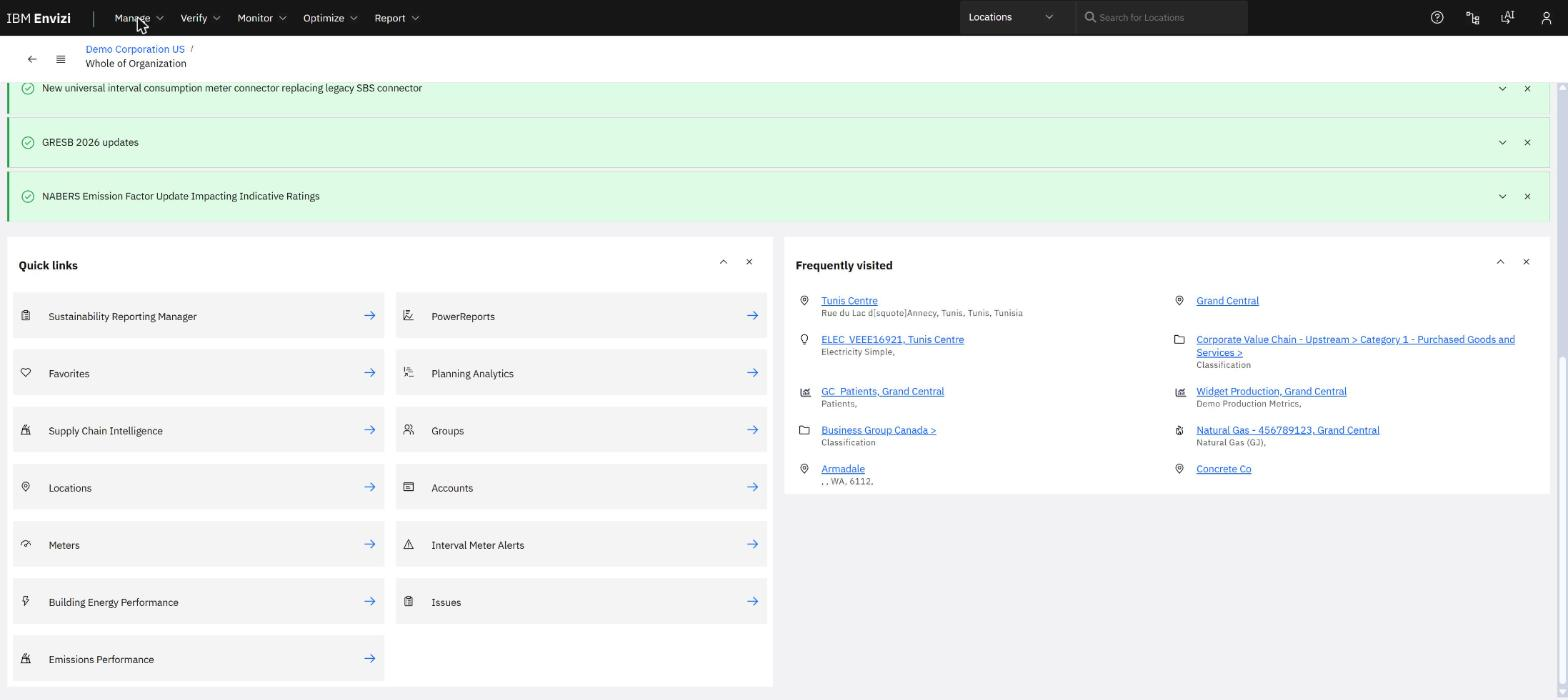
| Menu | What it is for | Examples on the demo system |
|---|---|---|
| Manage | Set up and load | Groups, Locations, Accounts, Meters; data health checks; targets and budgets; upload files |
| Verify | Check the money | Utility bill analytics for electricity, gas and water; budgets; bill checking |
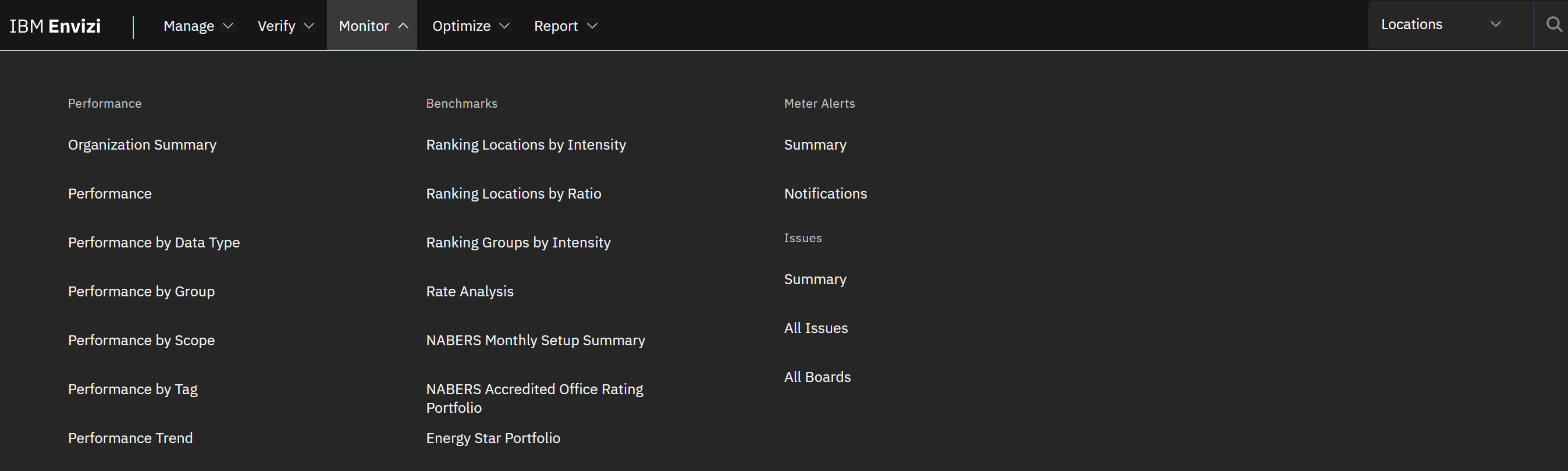
| Monitor | Watch performance | Performance by scope, group or tag; emissions performance; benchmarks; meter alerts; issues |
| Optimize | Improve | Building energy performance; programs and actions |
| Report | Publish | PowerReports; scheduled reports; Sustainability Reporting Manager |
3. The data model: group, location, account, record
| Object | Meaning | Demo example |
|---|---|---|
| Organisation | The reporting entity | Demo Corporation US |
| Group | A folder of locations. A location can sit in many groups. | Retail Group › Retail Properties |
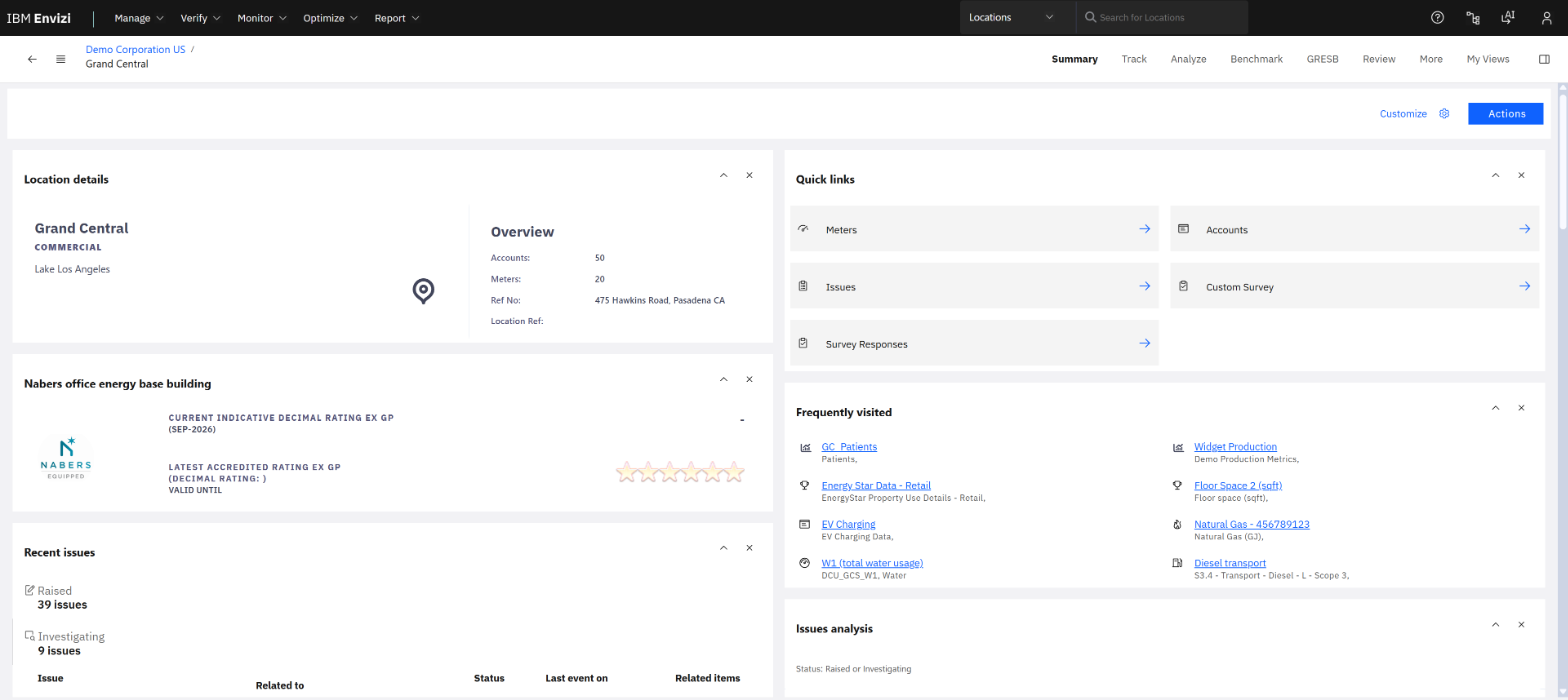
| Location | A place: a building, a plant, or a "virtual" place for corporate data | Grand Central |
| Account | One stream of data of one type at one location | Natural Gas - 456789123 |
| Record | One period of that stream: quantity, cost, dates | A month of gas in GJ and USD |
Everything Envizi reports is a sum of records. The scope, the unit and the emission factor all follow from the account's data type, so choosing the right account style when you create an account is the decision that matters.
4. Use case 1: build the data foundation
4.1 Locations
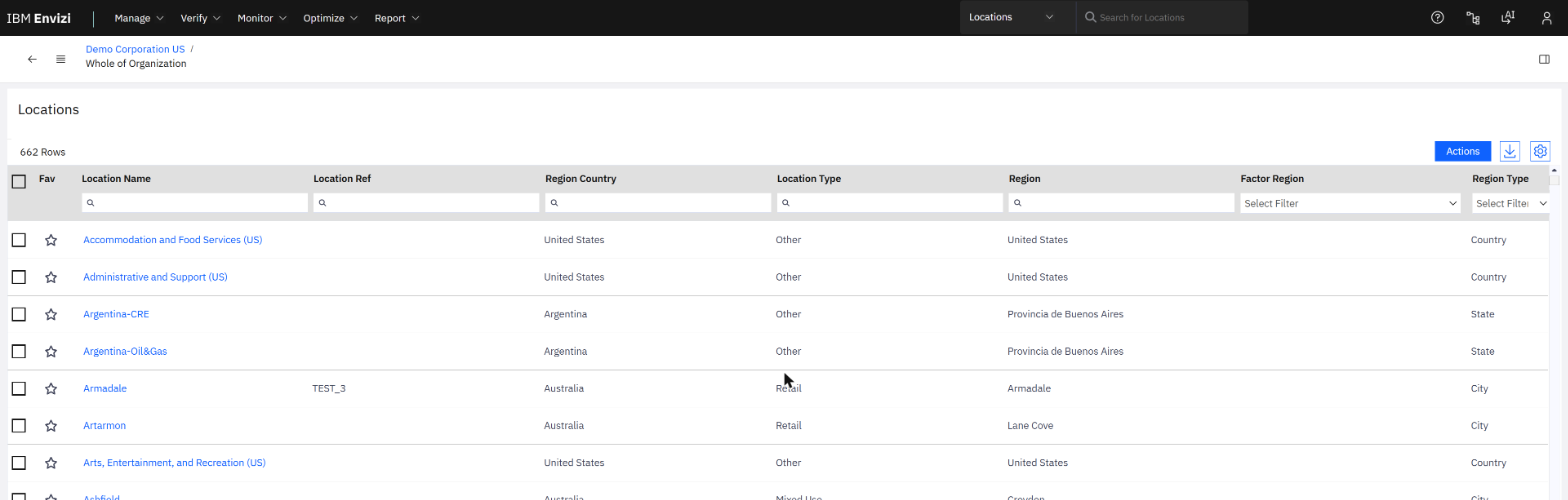
Manage › Locations lists every place in the organisation, with its type and the region that decides its emission factors.
4.2 One location: Grand Central
4.3 The hierarchy
The icon next to the back arrow opens the organisation tree. It is the fastest way to see how data is organised.
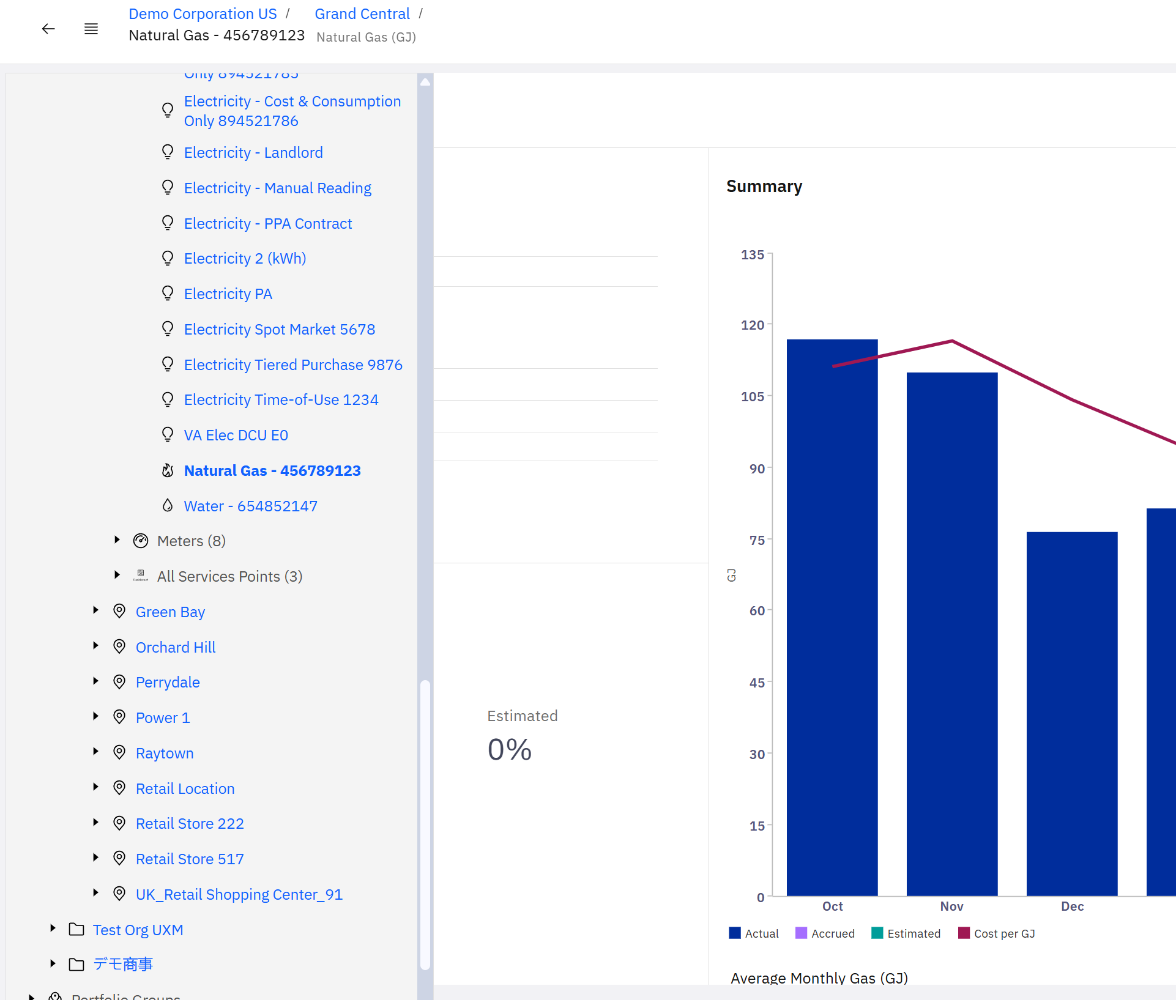
The top of the same tree holds the classification groups. On the demo they include business groups, "Corporate Value Chain - Upstream" and "- Downstream" for Scope 3 data, corporate social metrics, and a group named "MREF_Maximo".
4.4 One account: the gas bill
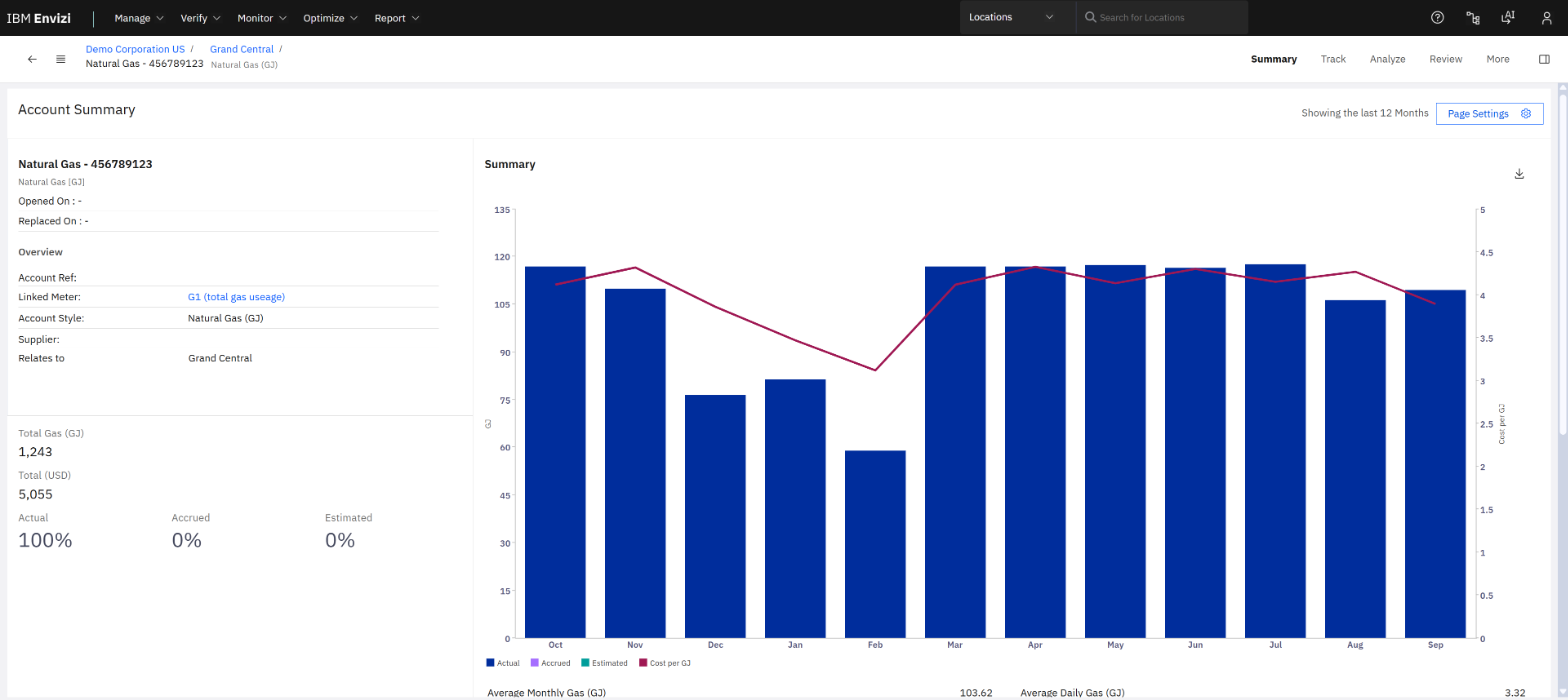
Three things on this page are worth reading closely:
- Actual / Accrued / Estimated. When a bill is missing, Envizi can fill the gap with an accrual so the totals do not drop. The split tells you how much of a number is measured.
- Linked meter. The account is tied to a meter, "G1 (total gas usage)".
- Account style. "Natural Gas (GJ)" fixes the unit and the factor that will be applied.
Data reaches accounts in several ways: file uploads with templates (Manage › Data Files), connectors, and manual entry. Manage › Data Integrity then offers health checks by supplier, location and account.
5. Use case 2: report emissions
5.1 PowerReports
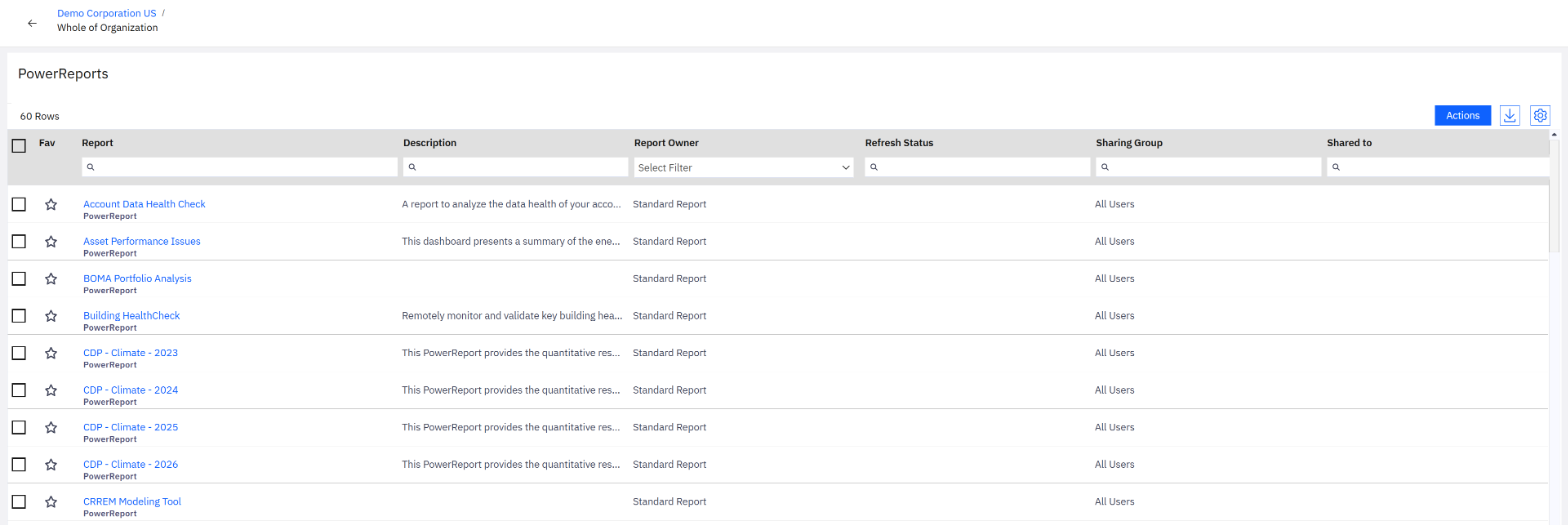
Report › PowerReports lists the Power BI reports embedded in Envizi: 60 on the demo, including one per CDP questionnaire year.
5.2 The executive view
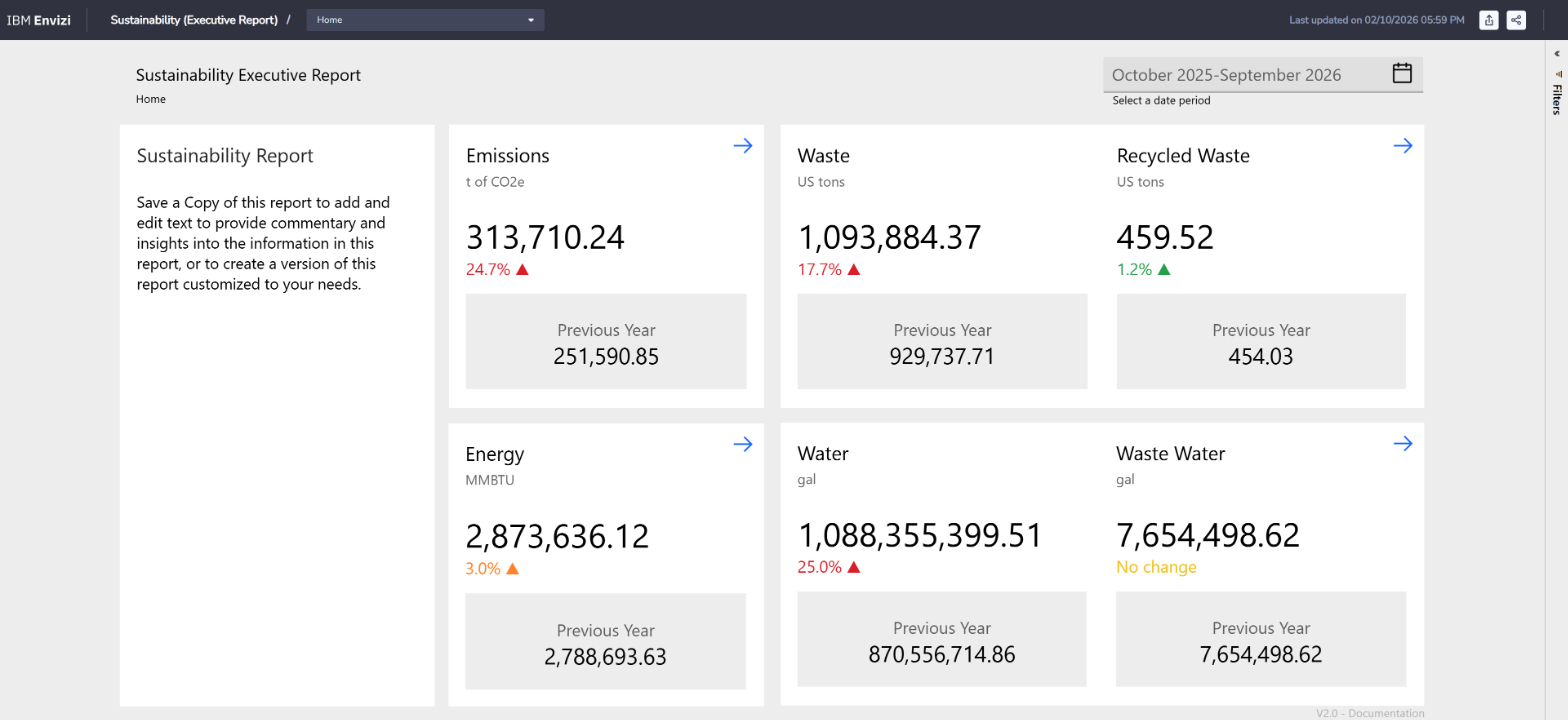
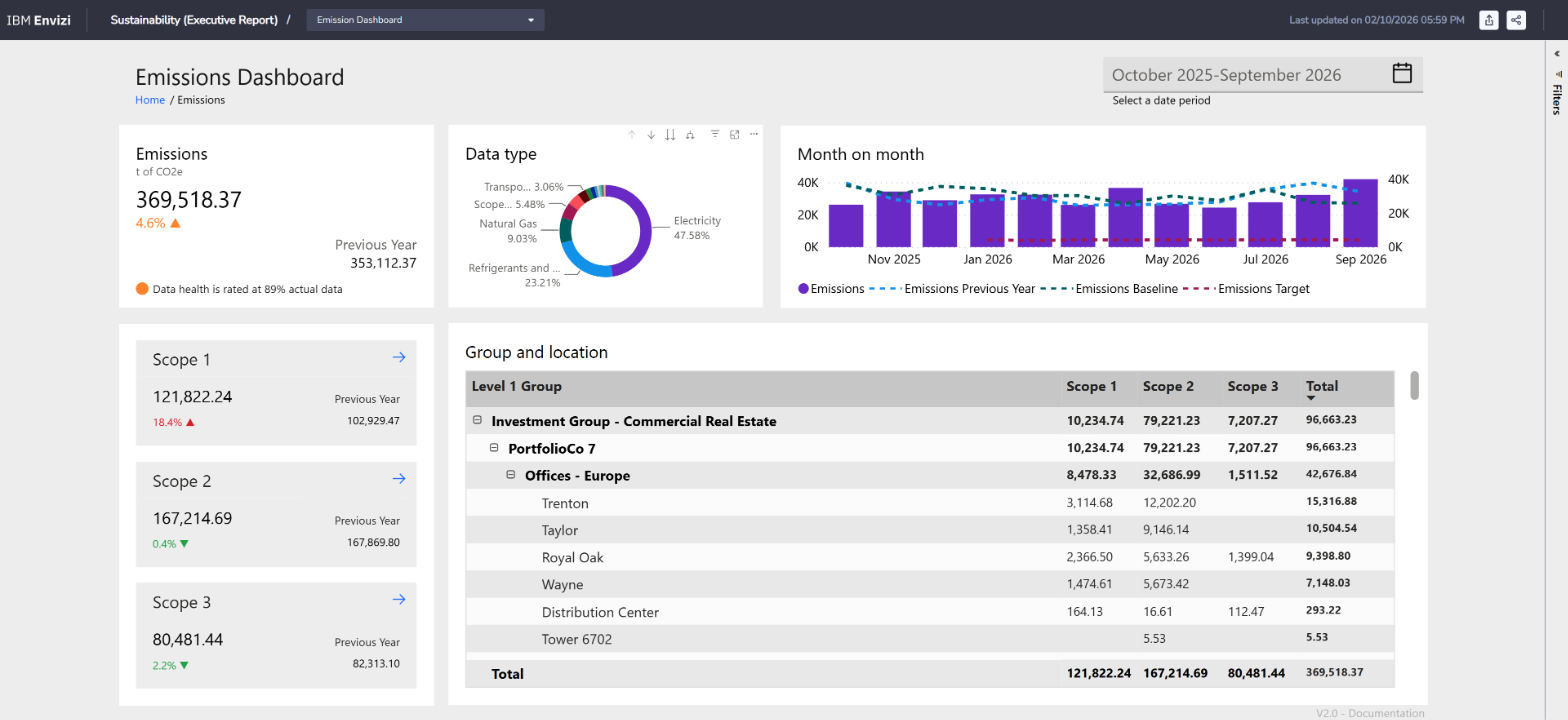
The arrow on the Emissions tile opens the emissions dashboard:
| Reading | Value on the demo |
|---|---|
| Total on the emissions dashboard | 369,518 t CO2e, up 4.6% |
| Largest data type | Electricity, 47.6% |
| Data health | 89% actual data |
| Largest group shown | Investment Group - Commercial Real Estate, 96,663 t |
5.3 Scope 3
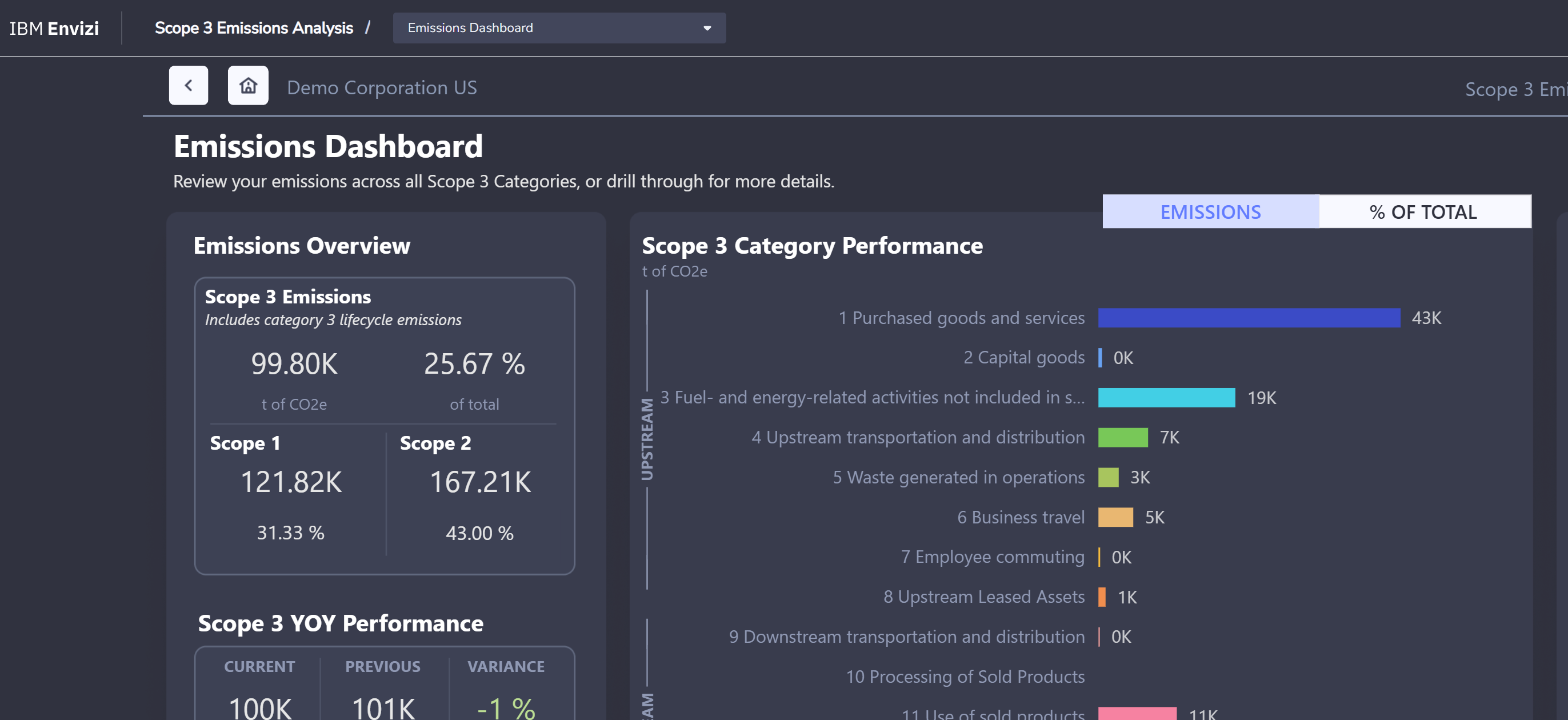
Scope 3 is where most organisations start with spend data (dollars multiplied by an industry factor) and move towards supplier- and product-specific figures for the categories that matter most. The same report has pages for the accuracy of the calculation method and for data health, so you can say how good the number is as well as how big.
5.4 Performance against last year
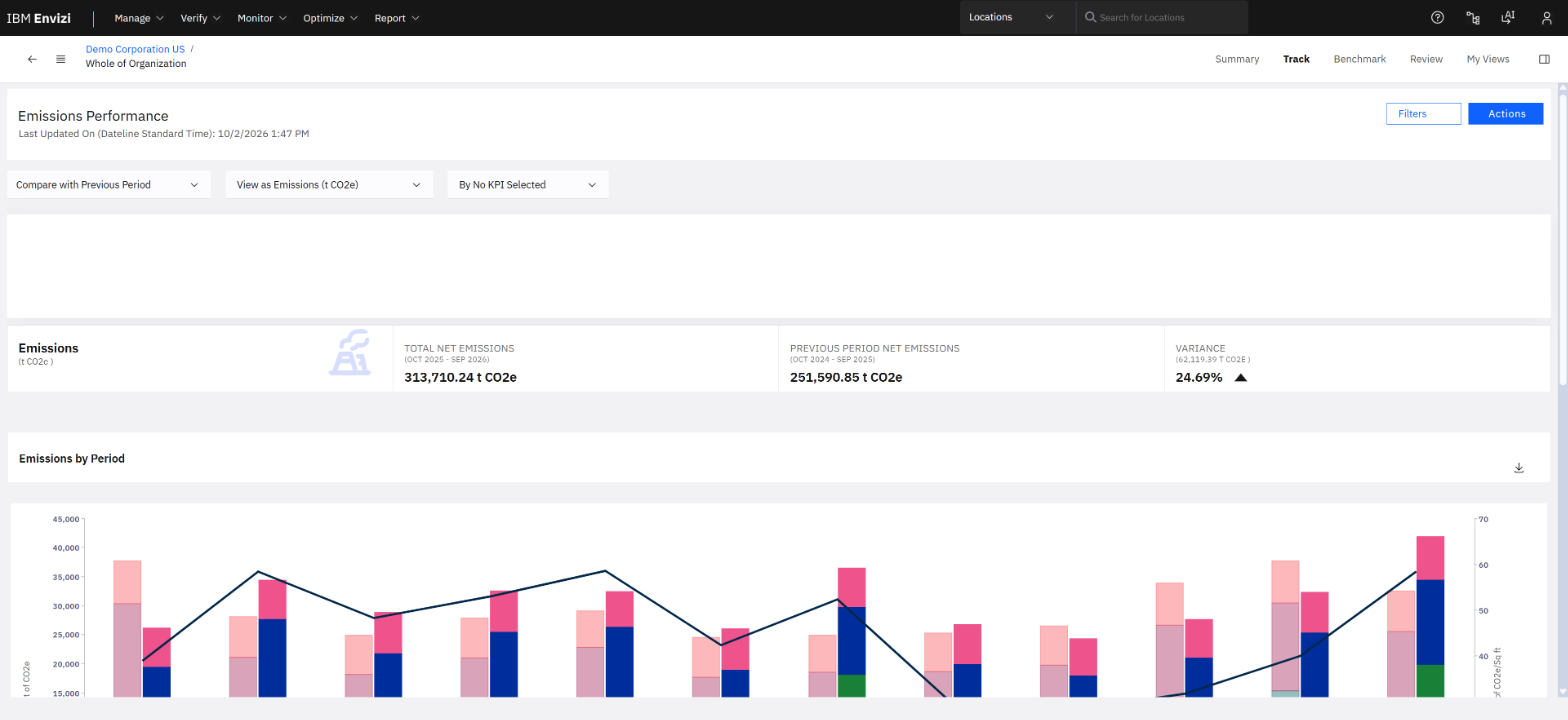
Monitor › Emissions Performance is not a Power BI report. It is a native page, and it works at any level of the hierarchy.
6. Use case 3: answer a disclosure
Report › Sustainability Reporting Manager opens in its own tab. A disclosure is a project: a set of questions taken from one or more frameworks, each with an assignee, a reviewer, a status and due dates.
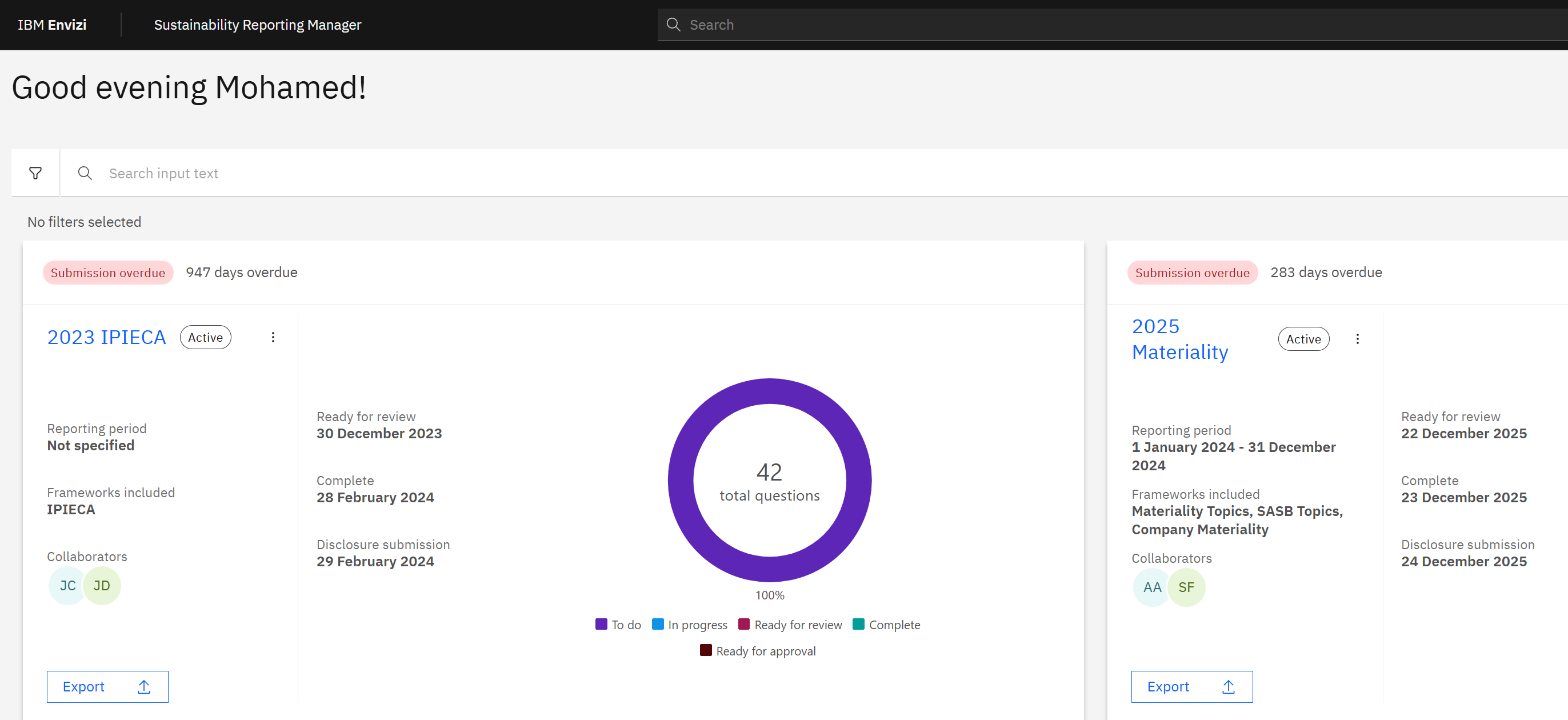
The frameworks used across the demo disclosures: IPIECA, SASB, TCFD, ESRS, GRI, ASRS S1 and S2, IFRS S2 (ISSB), and materiality topics. A framework library lets you pick questions; "Create disclosure" starts a new project.
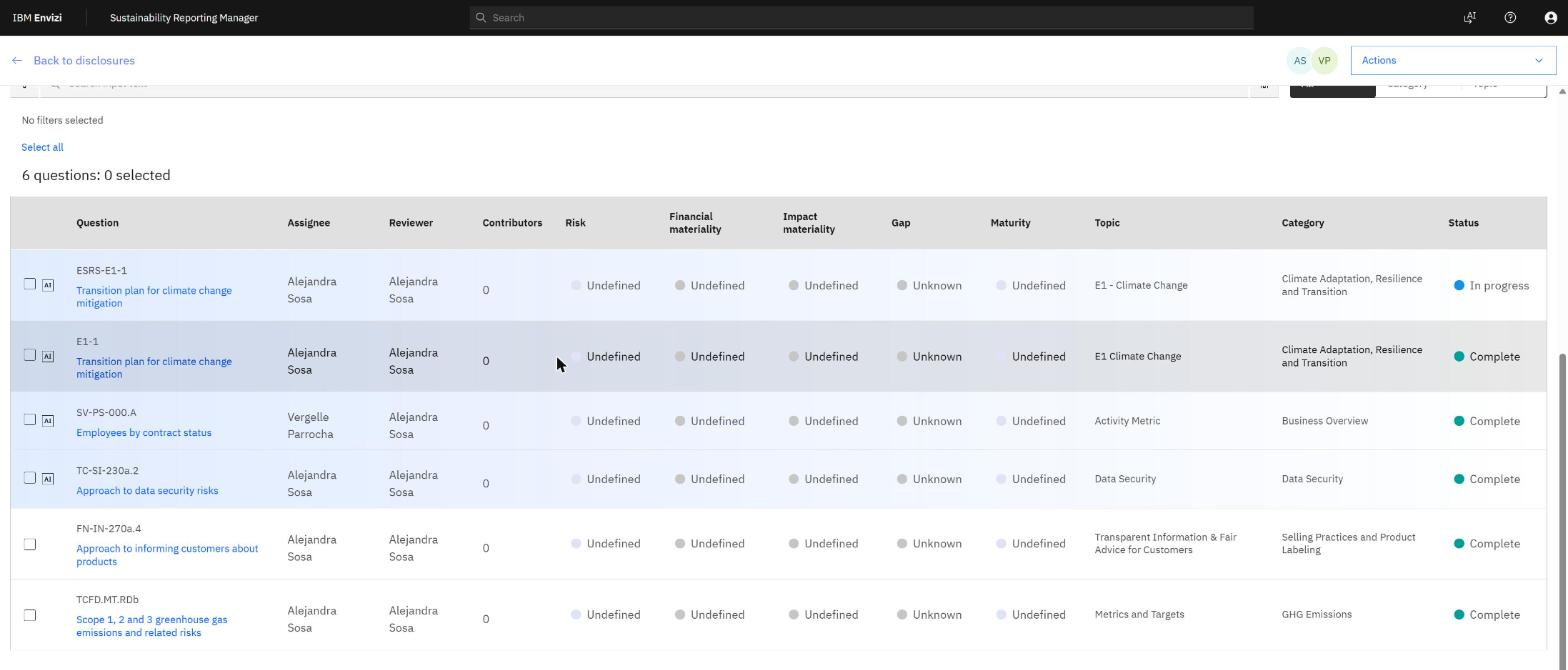
That last question is where the three use cases meet. The answer to "Scope 1, 2 and 3 emissions" is not typed by a person. It is the sum of the records in the accounts of section 4, converted by the factors of section 5. The disclosure tool adds what a spreadsheet cannot: who answered, who reviewed, what was said last year, and an export to a document when the work is done.
7. After the report: programs and actions
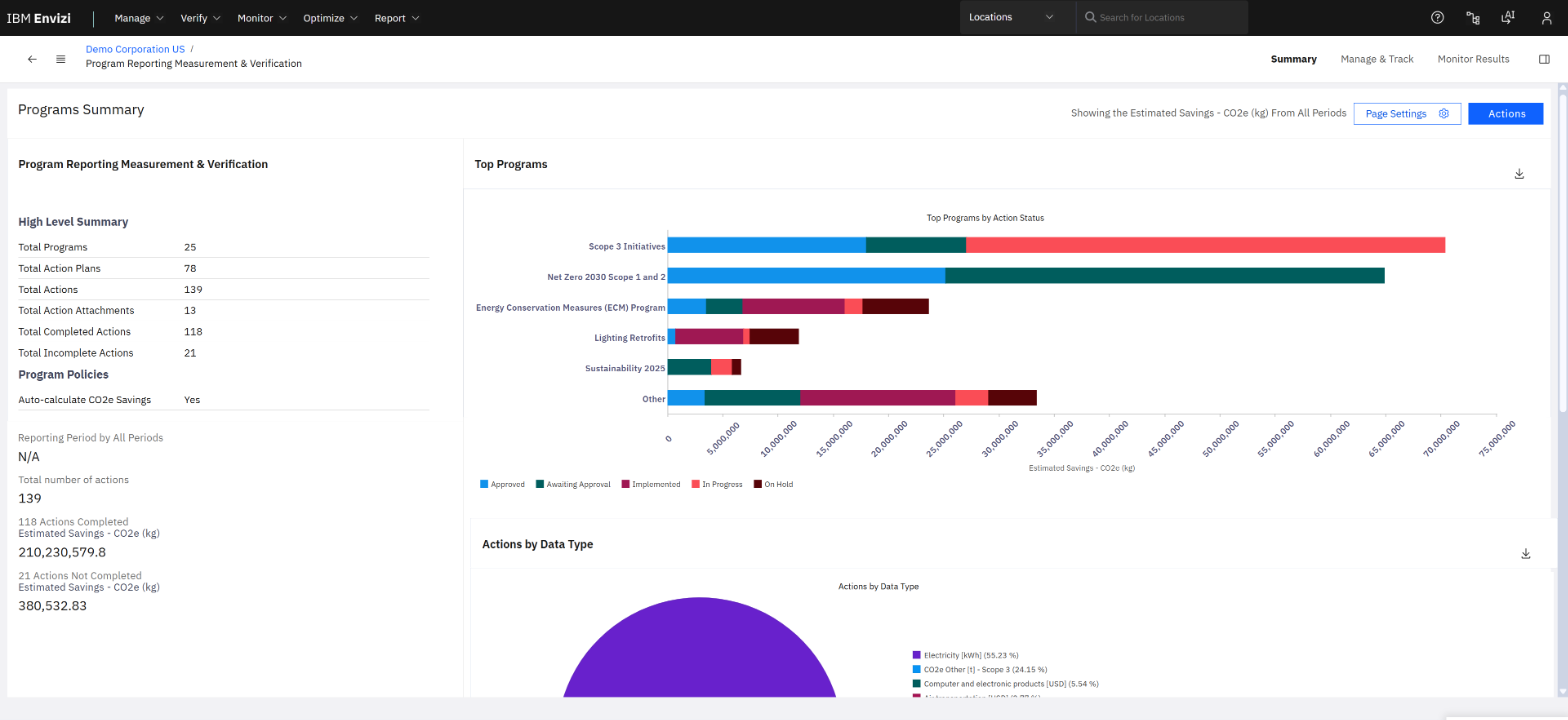
An action is one initiative, for example a lighting retrofit at one building, with an implementation cost, an estimated saving in energy, money and CO2e, a status and dates. The page also checks its own data: on the demo, 45 actions have no quantitative data and 13 have no finish date.
8. Things to get right early
9. Check yourself
Where does a monthly electricity bill go?
Into a record on an electricity account at the location that received the bill.
Business travel has no building. Where does it live?
In accounts under a corporate group or a virtual location, with a Scope 3 data type.
A manager asks "how sure are we of this number?" Which two things do you show?
The actual versus accrued split (data health), and for Scope 3 the calculation method behind each category.
What is the difference between a PowerReport and Emissions Performance?
A PowerReport is an embedded Power BI report that opens in its own tab. Emissions Performance is a native Envizi page that follows the hierarchy level you are on.
Written from IBM's Envizi demo organisation on 3 October 2026. The figures are demo data. The tour follows the order of IBM's own demonstration flow (data foundation, emissions, disclosures) in my own words; product behaviour on your tenant may differ with configuration and licence.