IBM Maximo Real Estate and Facilities · Capital planning · A guide for students and junior consultants
One tired air handler, three desks, one plan
How a facilities team turns "this building is getting old" into a funded, scheduled, contracted project. We follow one real example from IBM's demo data, step by step, and explain every term and every number on the way.
- What capital planning is, and why it is harder than it looks.
- How to read a building's condition with the Facility Condition Index (FCI), and calculate it yourself.
- How needs become opportunities, funding requests, programs and finally capital projects.
- How to read payback, ROI and NPV, and a project budget line by line.
- Where each of these lives in Maximo Real Estate and Facilities (MREF), so you can find it in a demo.
Reading time: about 25 minutes. No prior knowledge needed beyond basic arithmetic.
Before we startCapital planning in two minutes
An organization spends money on its buildings in two very different ways:
Money spent every year to run the building: cleaning, energy, small repairs, service contracts. It is used up within the year.
Money spent once to create or renew something that lasts many years: a new roof, a new HVAC system, a renovation. It is planned years ahead and usually needs approval.
Capital planning is deciding which capital projects to fund, when, and with which money. It is hard for three reasons:
- There is never enough money. The list of needs is always longer than the budget, so you must choose.
- Doing nothing has a cost too. A building left alone gets worse every year, and repairs get more expensive.
- Many people are involved. The person who sees the problem, the person who owns the budget and the person who delivers the work are usually not the same, and information gets lost between them.
MREF supports the whole chain in one system. Here is the path we will walk:
The cast. The building condition manager (demo login bding) knows what is wearing out.
The program manager (pprogram) owns the money for the Charlotte campus. The project manager
(mprojects) delivers the work. And the building: the Charlotte Watson Center, 188,796 square feet of offices
at 555 South College Street, Charlotte, owned by IBM's demo company GreenPoint.
Chapter 1The building speaks
A weak capital plan is built from what people ask for. A good one starts from what the buildings need. So our story starts on the building condition manager's home page, with a measurement.
FCI = cost of all repairs needed ÷ cost to replace the whole building (the replacement value).
It is a ratio, so you can compare a small shop and a large tower. Common thresholds (the ones used on these screens): 0 to 0.05 good, 0.05 to 0.10 fair, above 0.10 poor.
A building costs $10,000,000 to replace and has $800,000 of repairs waiting. FCI = 800,000 ÷ 10,000,000 = 0.08: fair. If nothing is done and the repairs grow to $1,200,000, FCI = 0.12: poor.
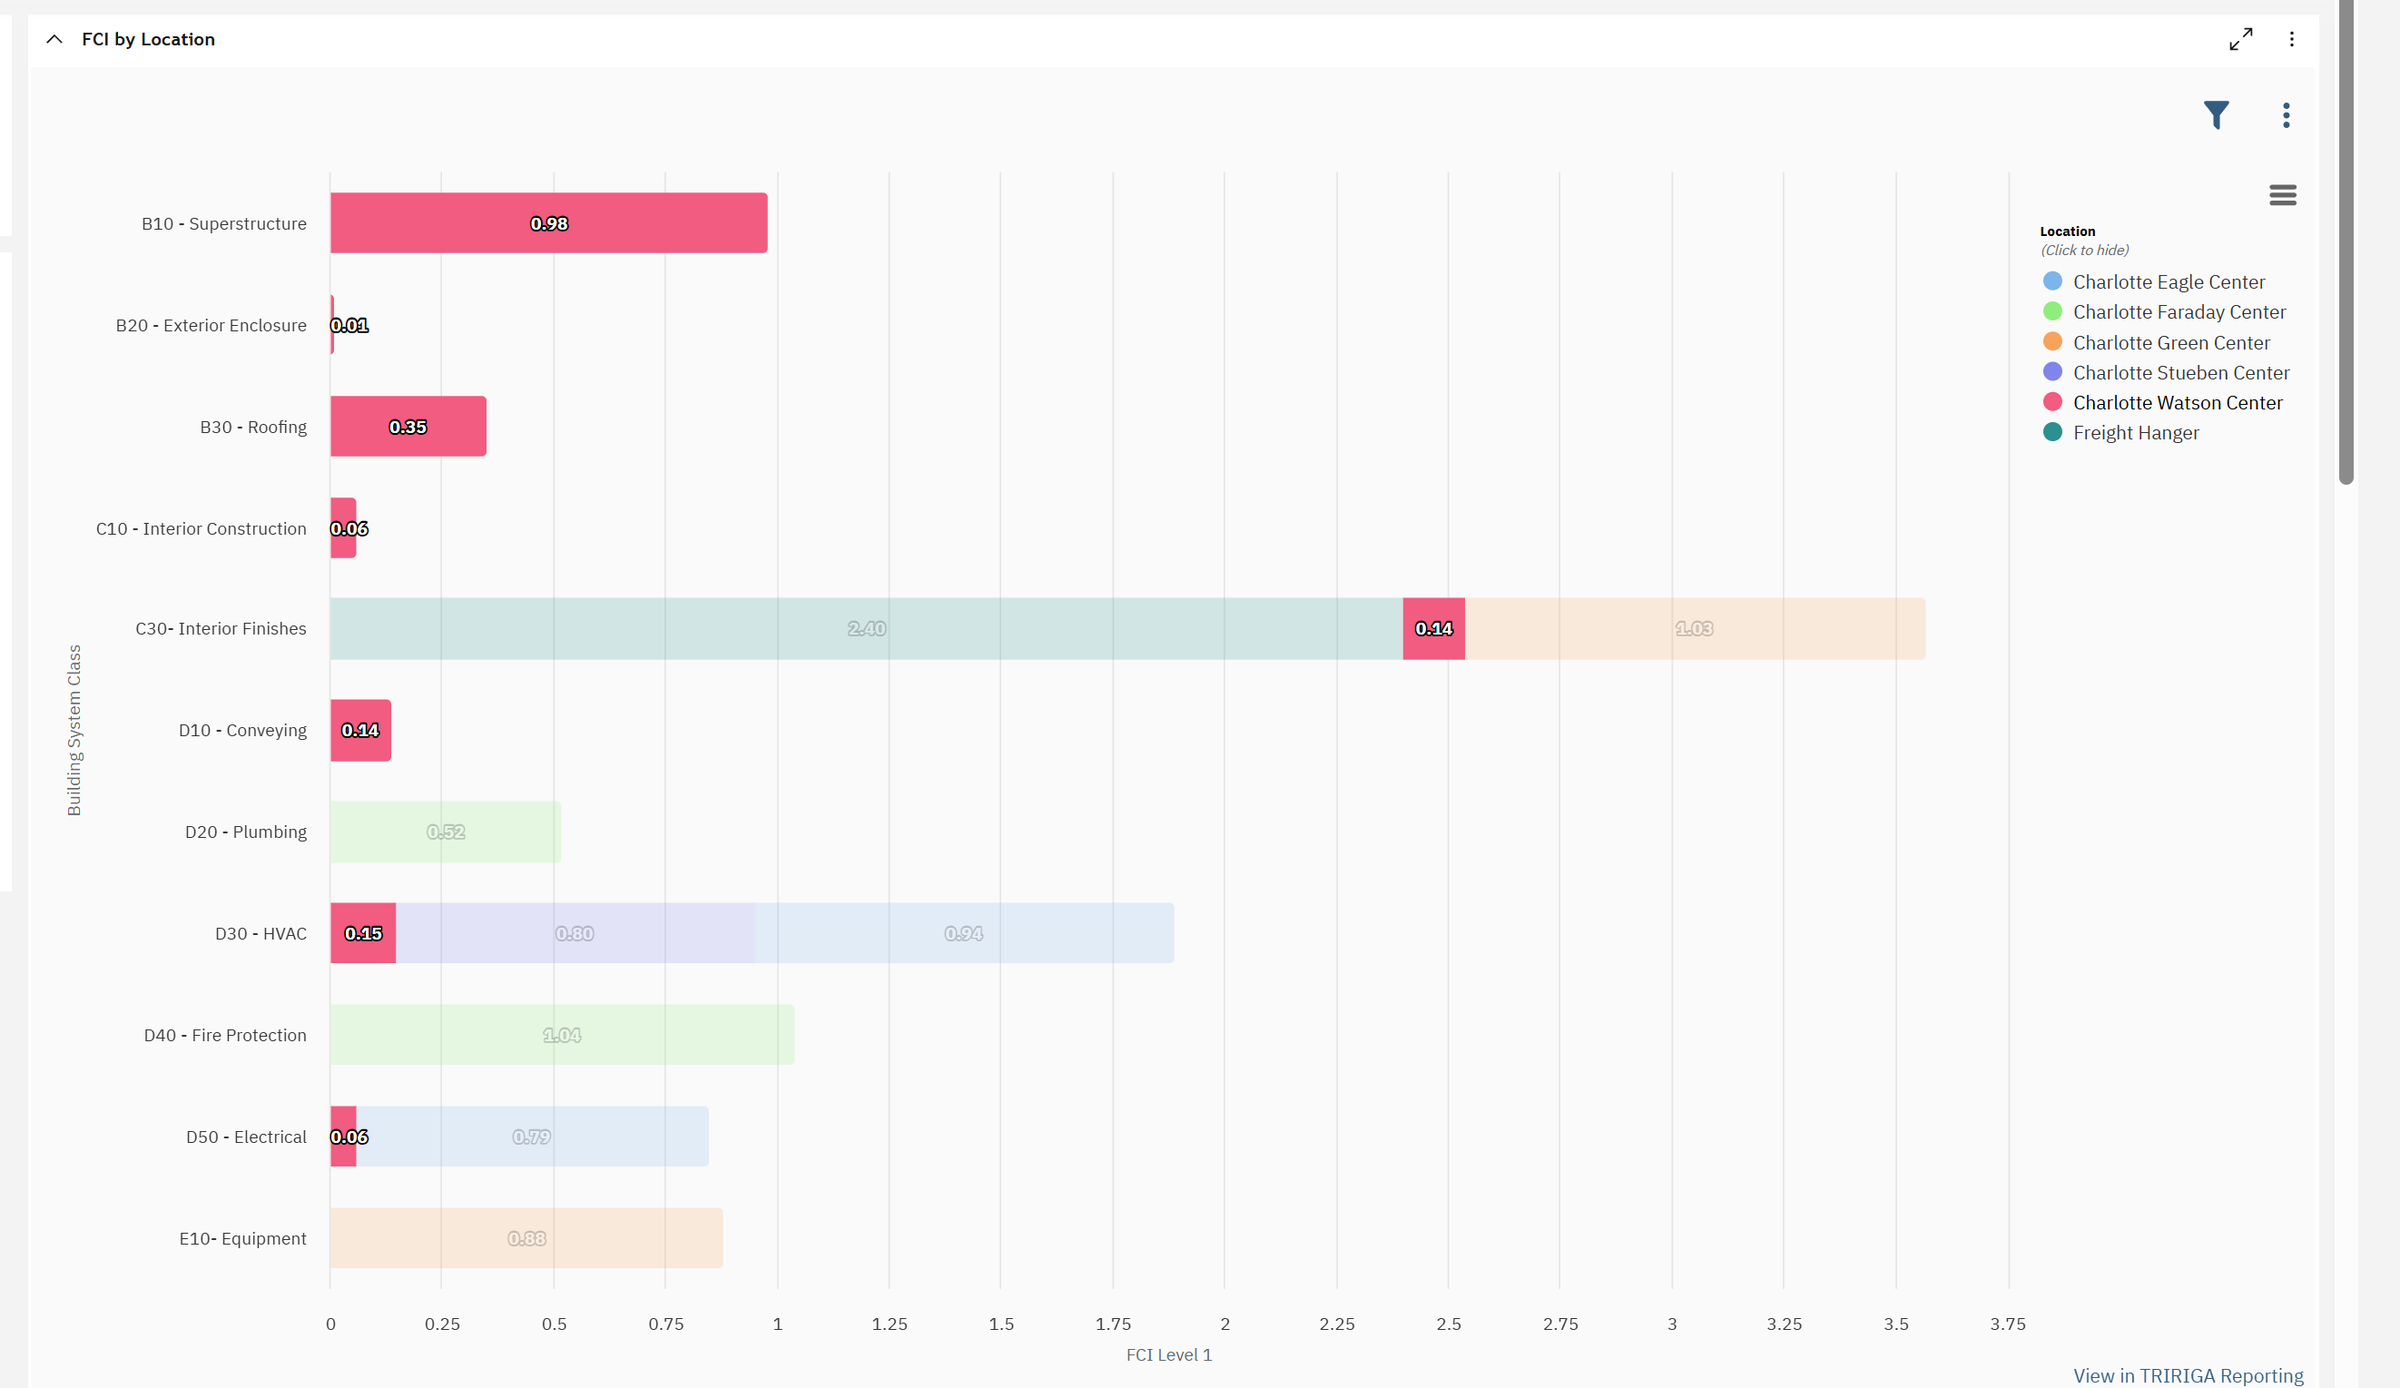
MREF does not stop at one number per building. It calculates the FCI for each building system, using UNIFORMAT, the standard classification of building parts: B is the shell (B10 superstructure, B20 exterior walls and windows, B30 roofing), C the interiors, D the services (D10 elevators, D20 plumbing, D30 HVAC, D40 fire protection, D50 electrical), E the equipment. So the chart answers two questions at once: which building, and which part of it. At the Charlotte Watson Center the superstructure (0.98) and the roof (0.35) stand out.
Every problem found during an inspection is recorded as an opportunity: a need to repair, replace or improve something. Each one carries a building system, a priority, a repair class (replace, repair) and an estimated cost. IBM says "opportunity" rather than "defect" because some items are improvements, such as energy savings, not failures.
All the opportunities together form the backlog: the work the organization knows it should do. MREF groups it by priority, from 1 (critical failure is imminent) to 4 (wish list).
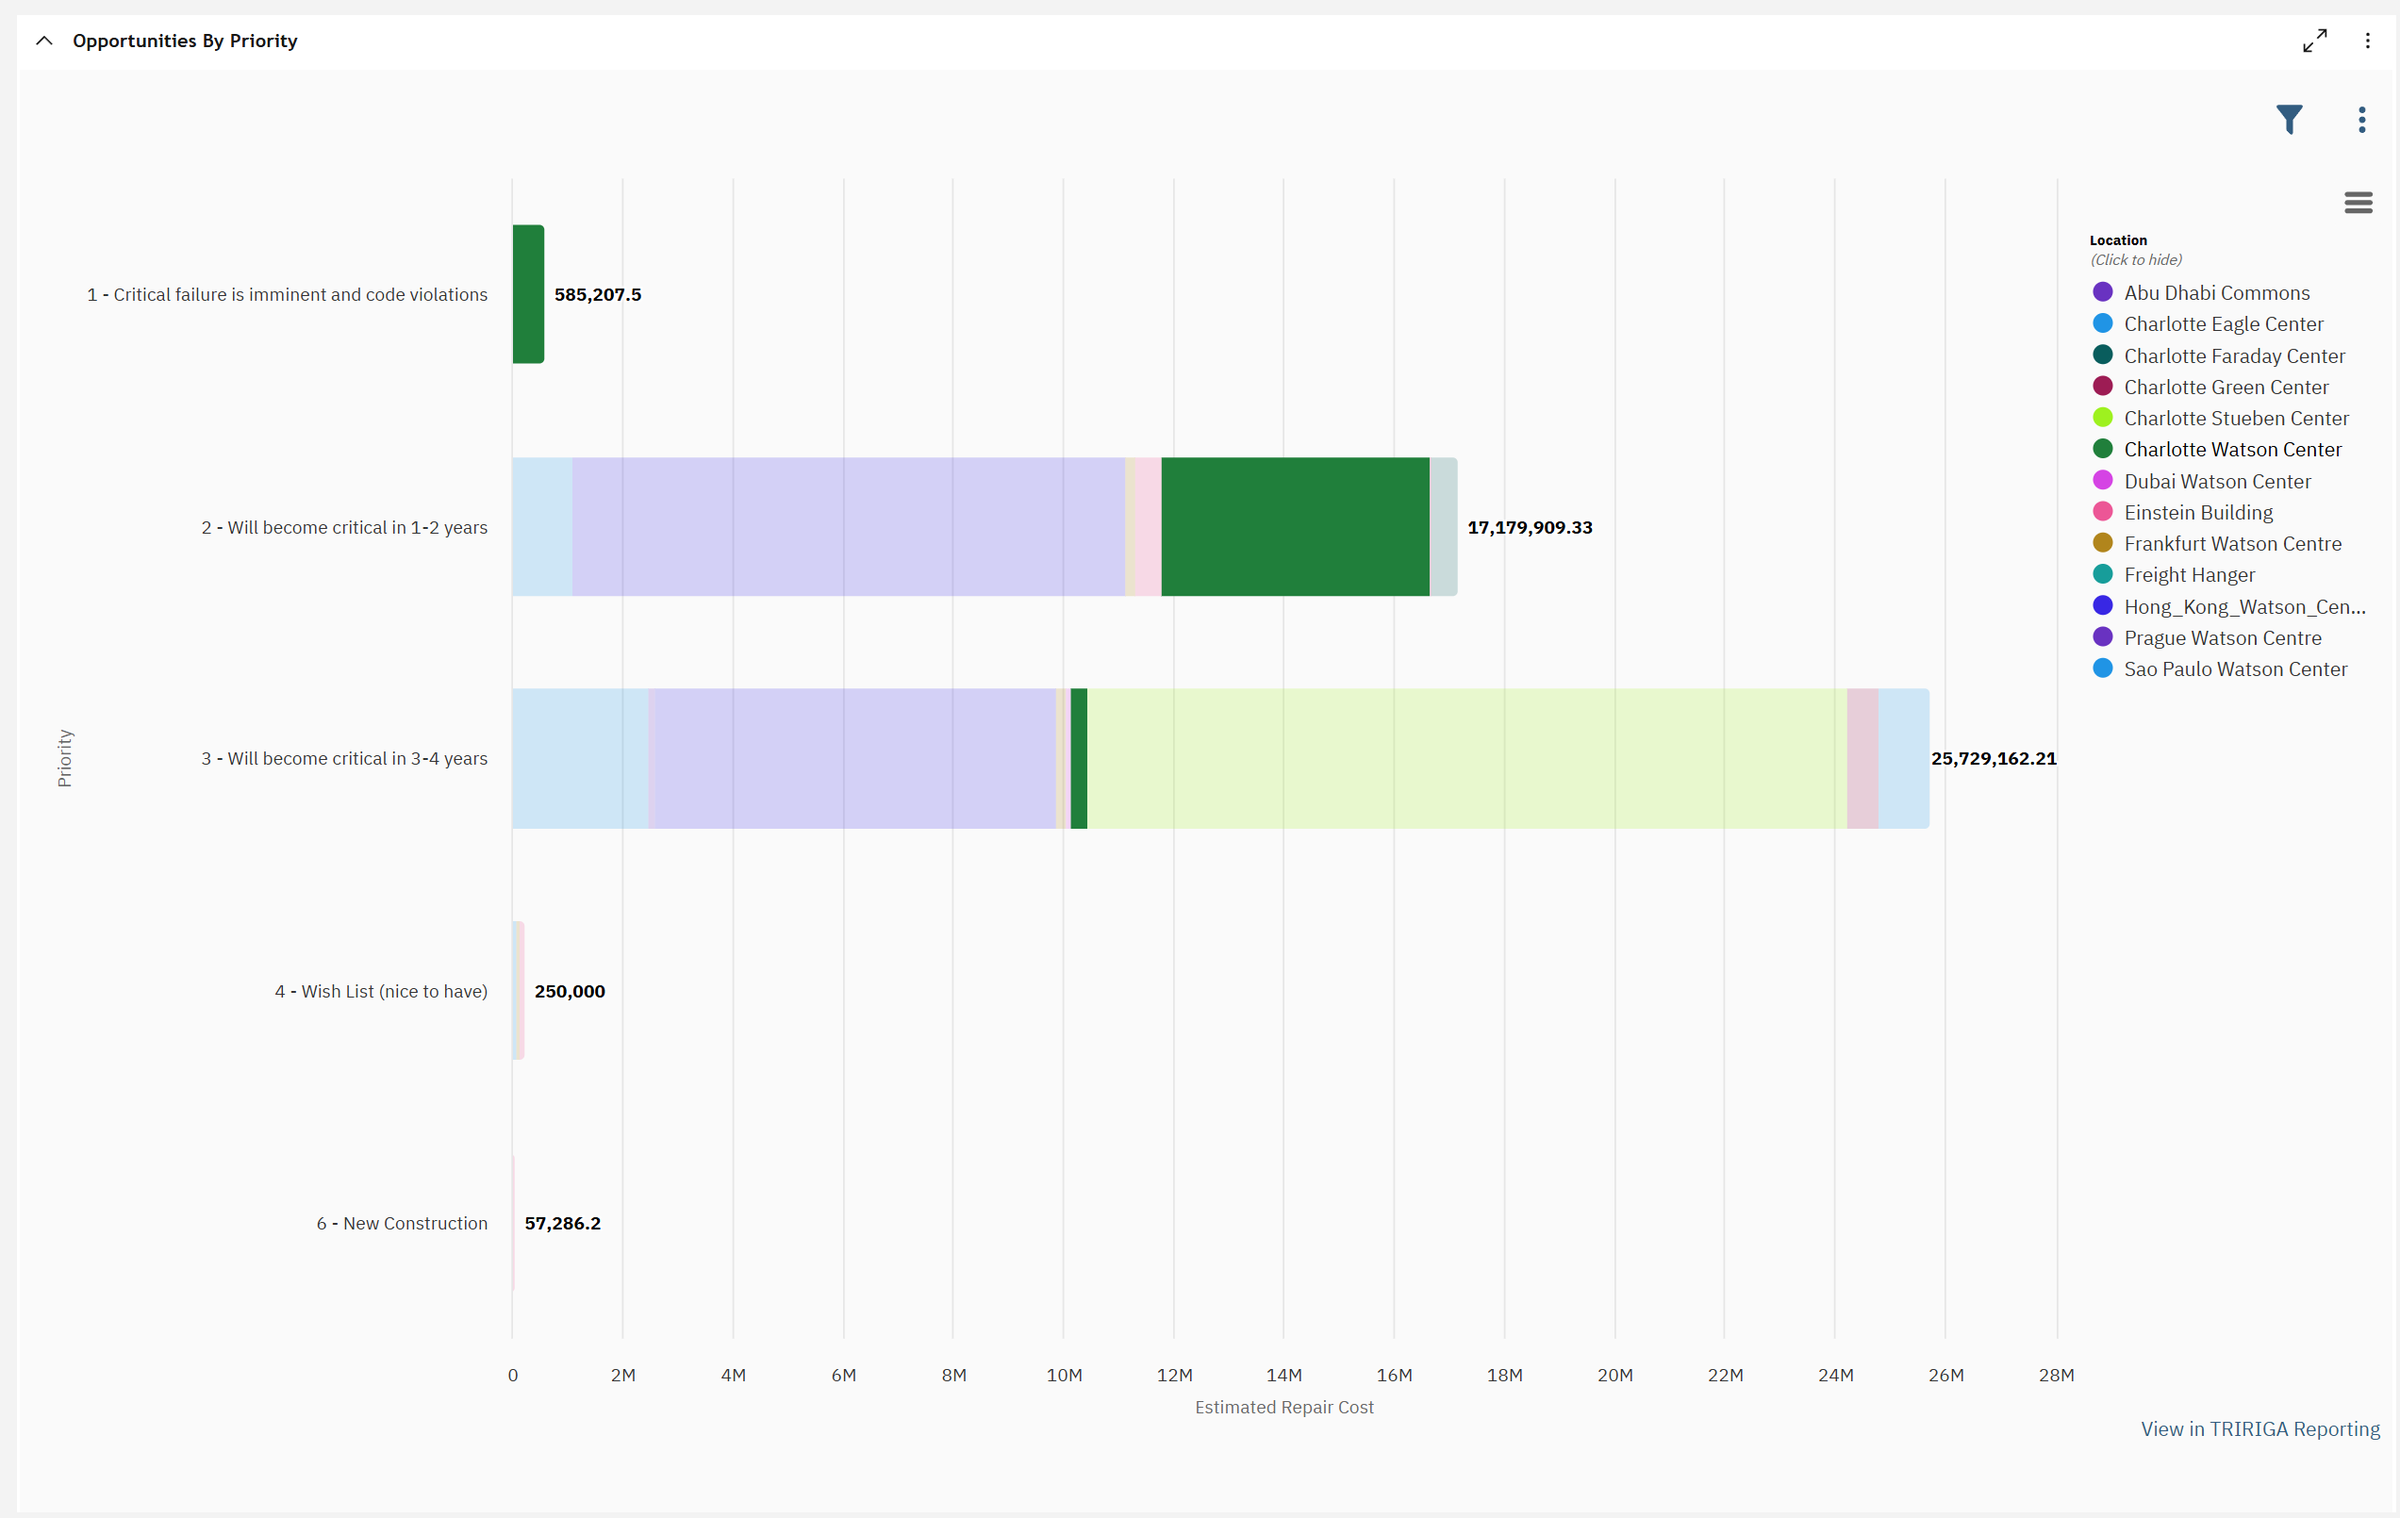
Add the bars: $585,207.50 + $17,179,909.33 + $25,729,162.21 + $250,000 + $57,286.20 ≈ $43.8 million of needs. Only $585,207.50 (about 1.3%) is priority 1, and all of it sits in one building. That is good news: the urgent part is small and known, so it can be funded first.
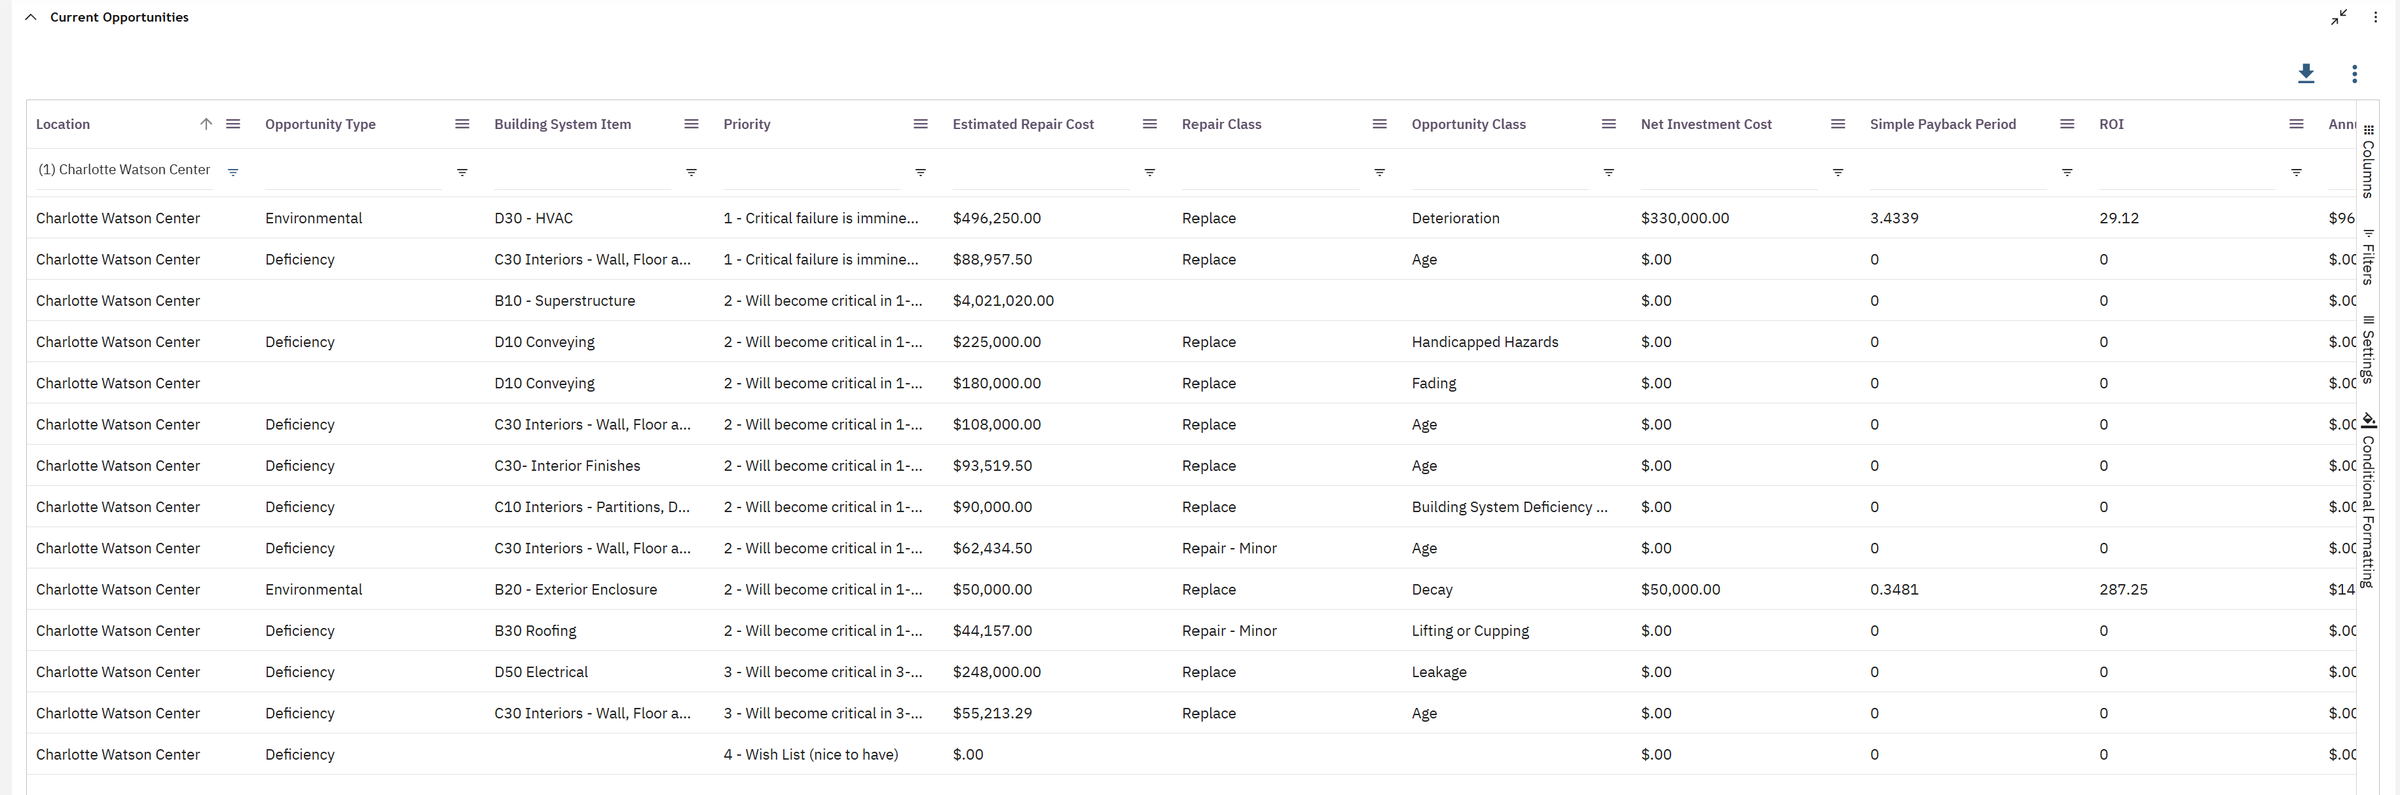
Our protagonist: D30 – HVAC. Priority 1. Replace. $496,250.
The heating, ventilation and air-conditioning system has to be replaced. Because the new system will also use less energy, MREF shows its business case on the same line: a net investment of $330,000 and $96,100 of energy savings a year.
Simple payback = net investment ÷ yearly savings: how many years until the savings have paid back the money.
ROI (here, simple yearly return) = yearly savings ÷ net investment × 100%.
Payback = $330,000 ÷ $96,100 = 3.43 years. ROI = $96,100 ÷ $330,000 = 29.1% a year. Both match the screen.
Now the exterior enclosure line: $50,000 for $143,627 of savings a year. Payback = 50,000 ÷ 143,627 = 0.35 years, about four months. ROI = 287%. Some needs are pure costs; some are excellent investments.
Look for the roof too: there is one roof line, a minor repair of $44,157 ("lifting or cupping"). Yet the roof's FCI is 0.35. A good analyst asks: is a minor repair really enough for a roof in that condition? That is how an inspection request is born.
bding. The three charts are on the home page. The full analysis
tools are under Maintenance › Facility Assessment.Chapter 2"What happens if we do nothing?"
That is always finance's first question. The building condition manager answers it with a Facility Assessment Analysis: a ten-year simulation of one or more buildings.
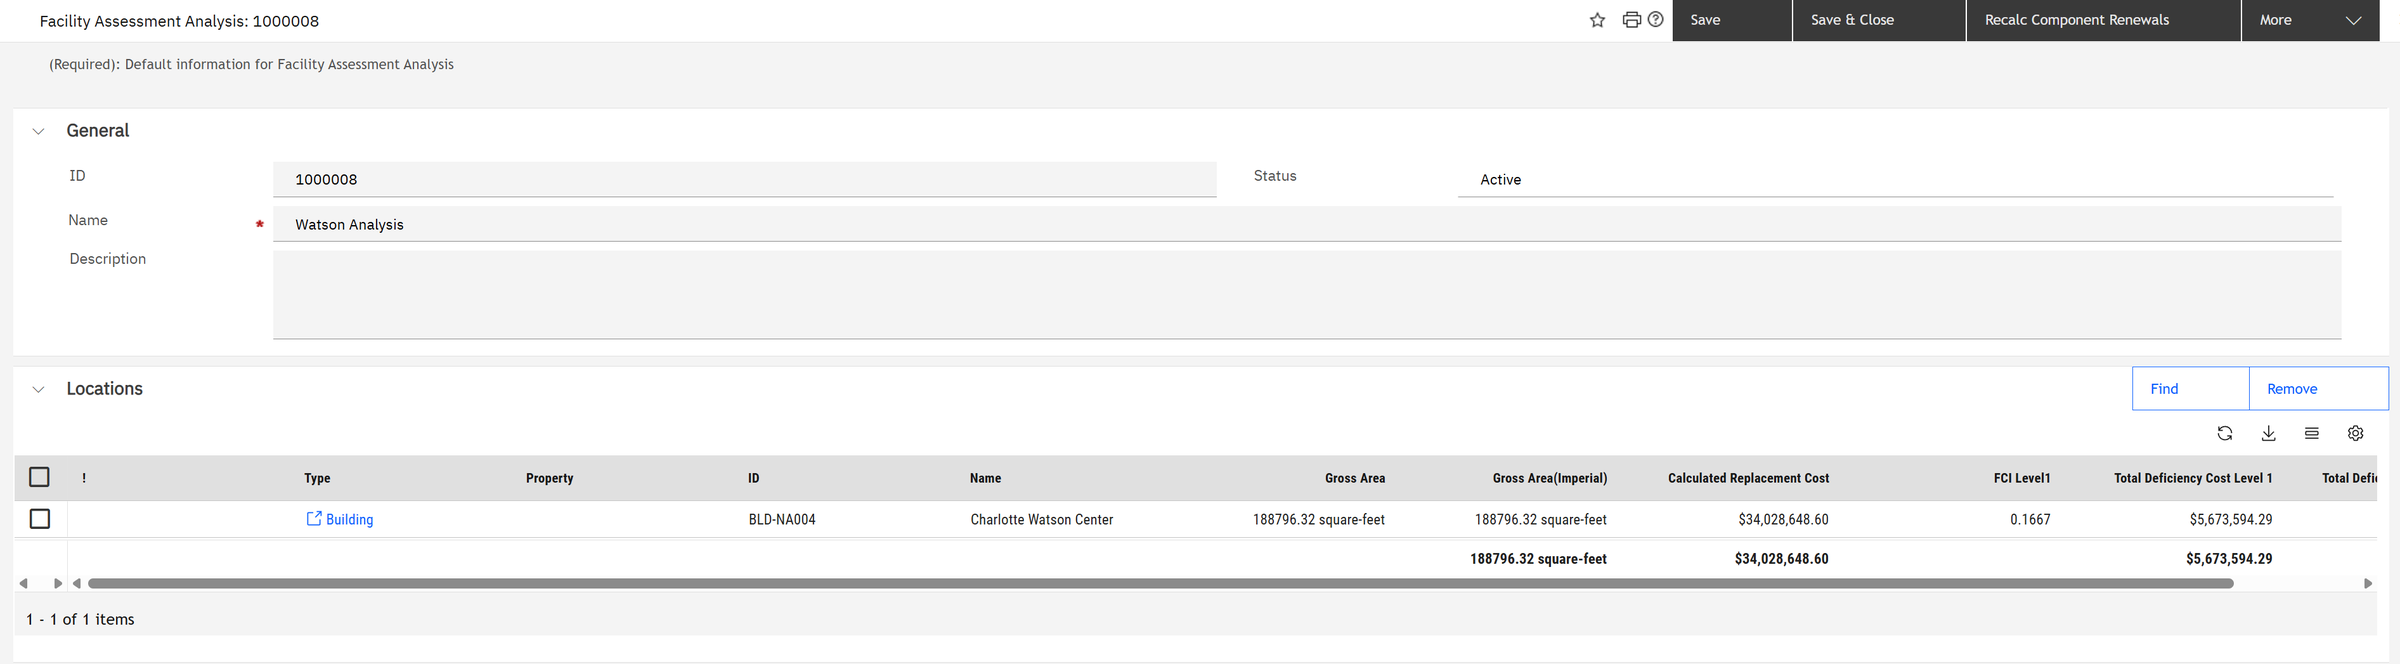
Deficiencies (repairs needed) $5,673,594.29 ÷ replacement value $34,028,648.60 = 0.1667. Poor, and above the 0.05 target.
The analysis also states its assumptions, which are as important as the result:
- Target FCI 0.05 within 10 years: where the organization wants the building to be.
- Construction cost inflation 3.7%: the same work costs more every year you wait.
- Backlog deterioration 2%: unrepaired problems get bigger every year.
- Component renewals: parts that reach the end of their life on schedule (over $4 million falls due in 2027 alone).
Then it plays the next ten years three ways:
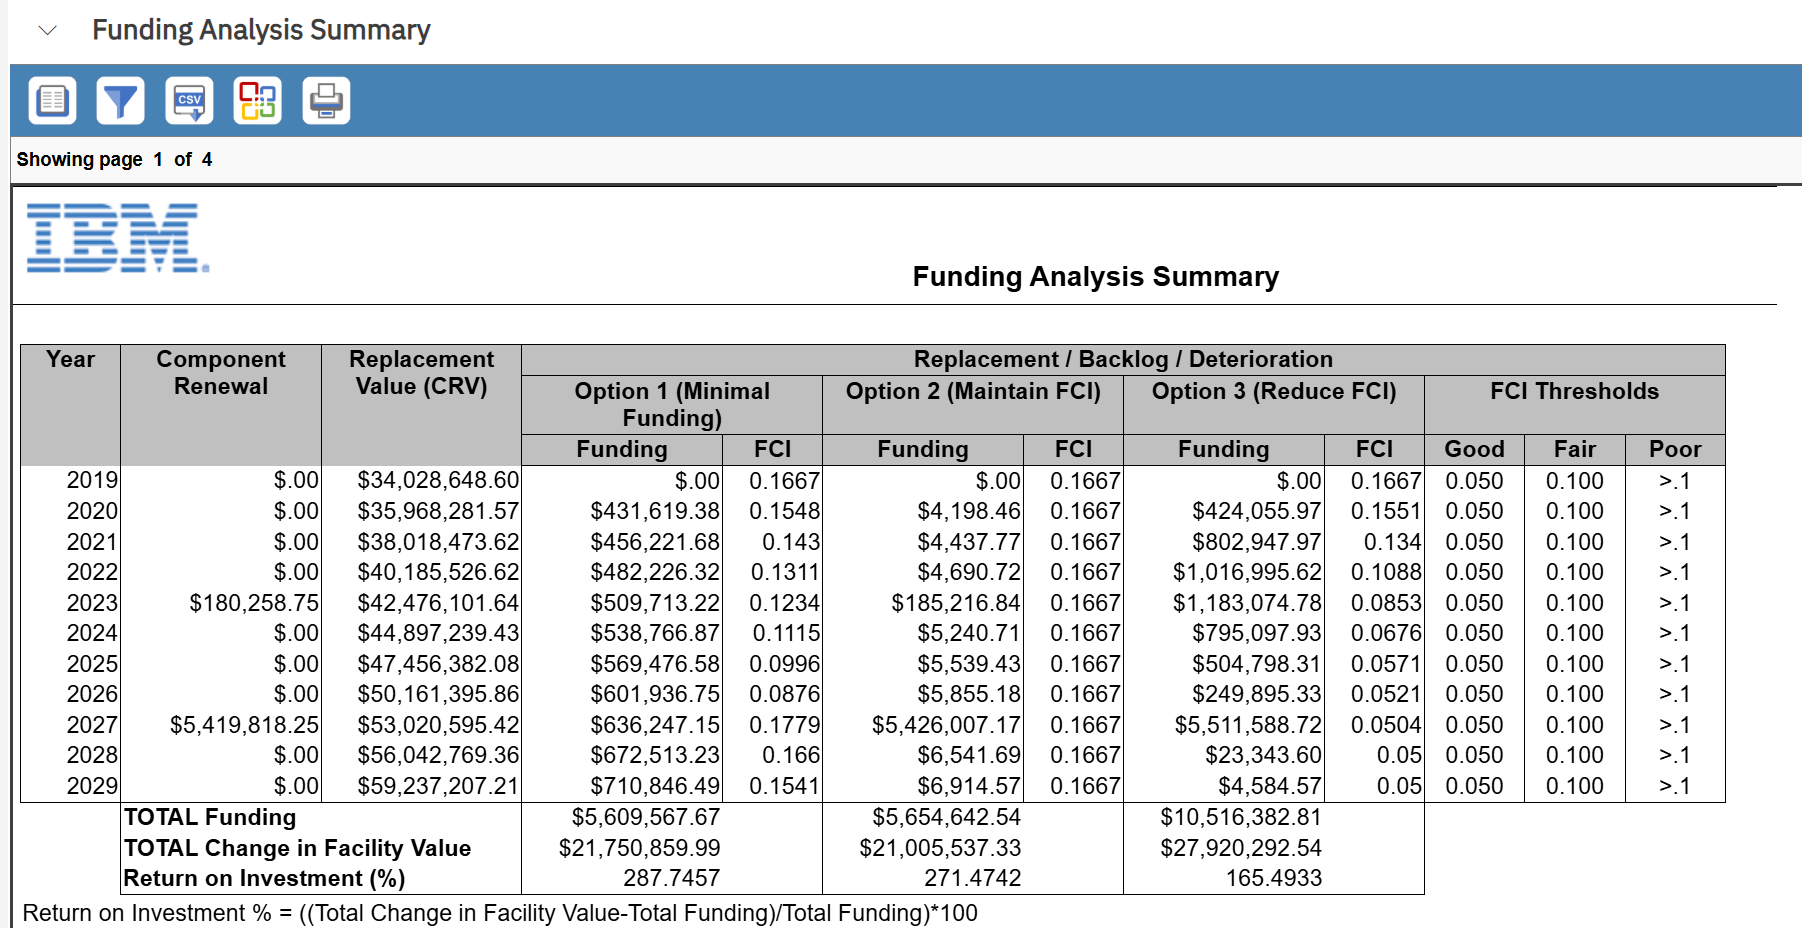
The building drifts. FCI stays poor (0.15–0.18).
Treading water at 0.1667. No better, no worse.
Reaches the 0.05 target ("good") by 2028.
Without this page, the conversation is "can we have $10 million?" With it, the conversation becomes: "for $5.6 million the building stays poor; for $10.5 million it becomes good in two years. Which do we choose?" That is a decision, not a negotiation. The report even calculates a return: the change in the building's value compared with the money spent.
Chapter 3Asking for the money
Knowing the need is not enough; someone must ask for the money in a form that can be compared with every other request.
A formal request for money: what (scope), where (location), for whom (organization), when (proposed dates and fiscal years) and how much. In MREF it can carry the opportunities it covers, so its cost comes straight from the assessment instead of from a guess.
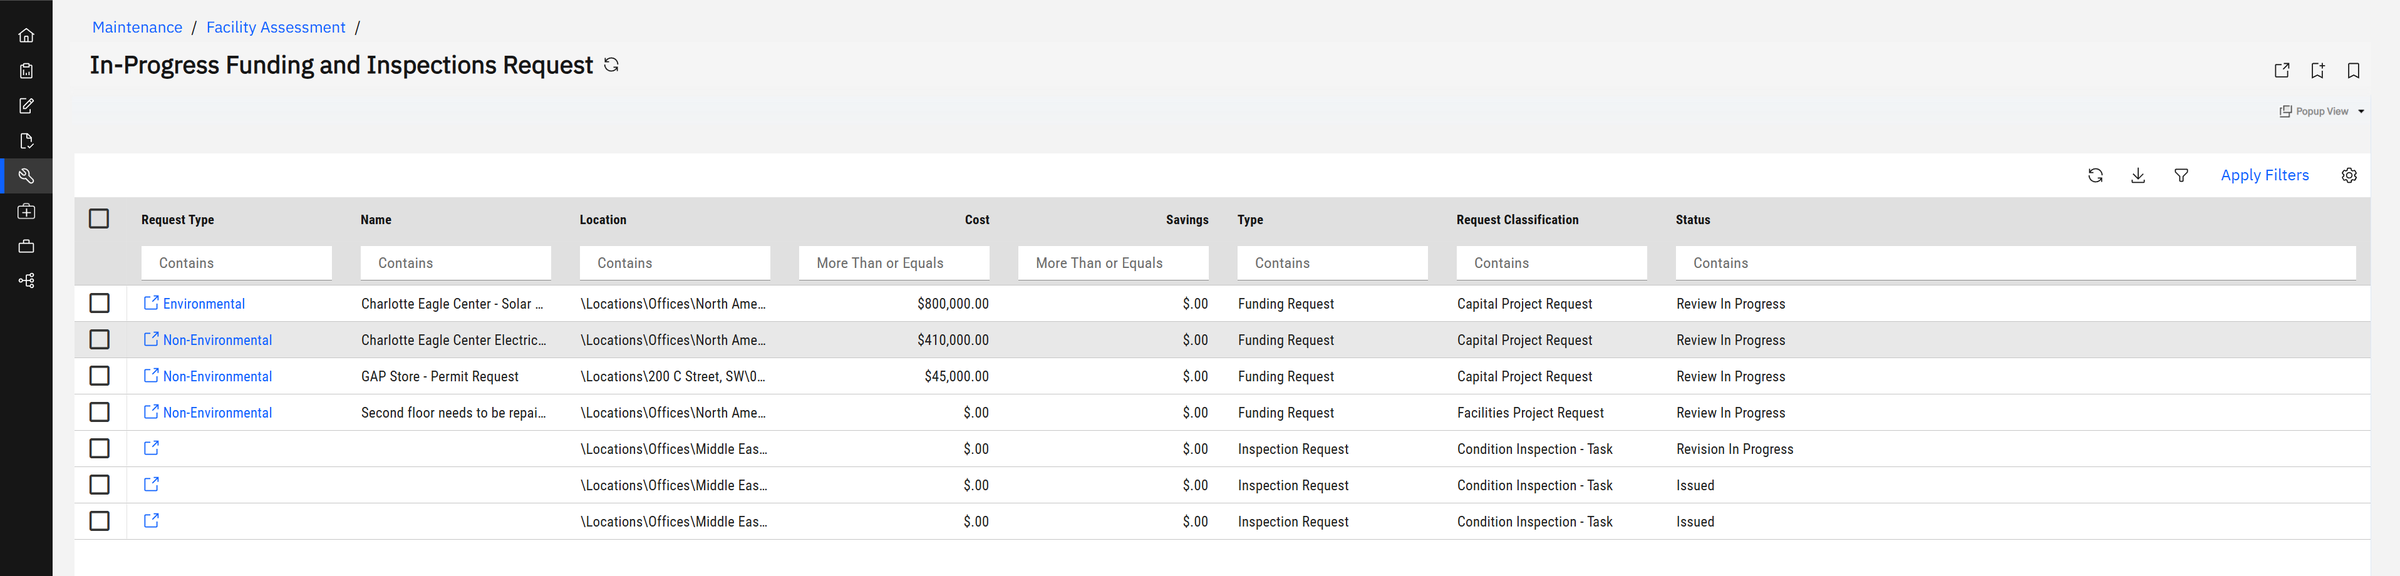
Let's open one: solar panels for the Charlotte Eagle Center, $800,000. The cost summary shows how the total is built: A (a manual estimate) + B (linked opportunities) + C (detailed line items) + D (extra costs) = E (total request).

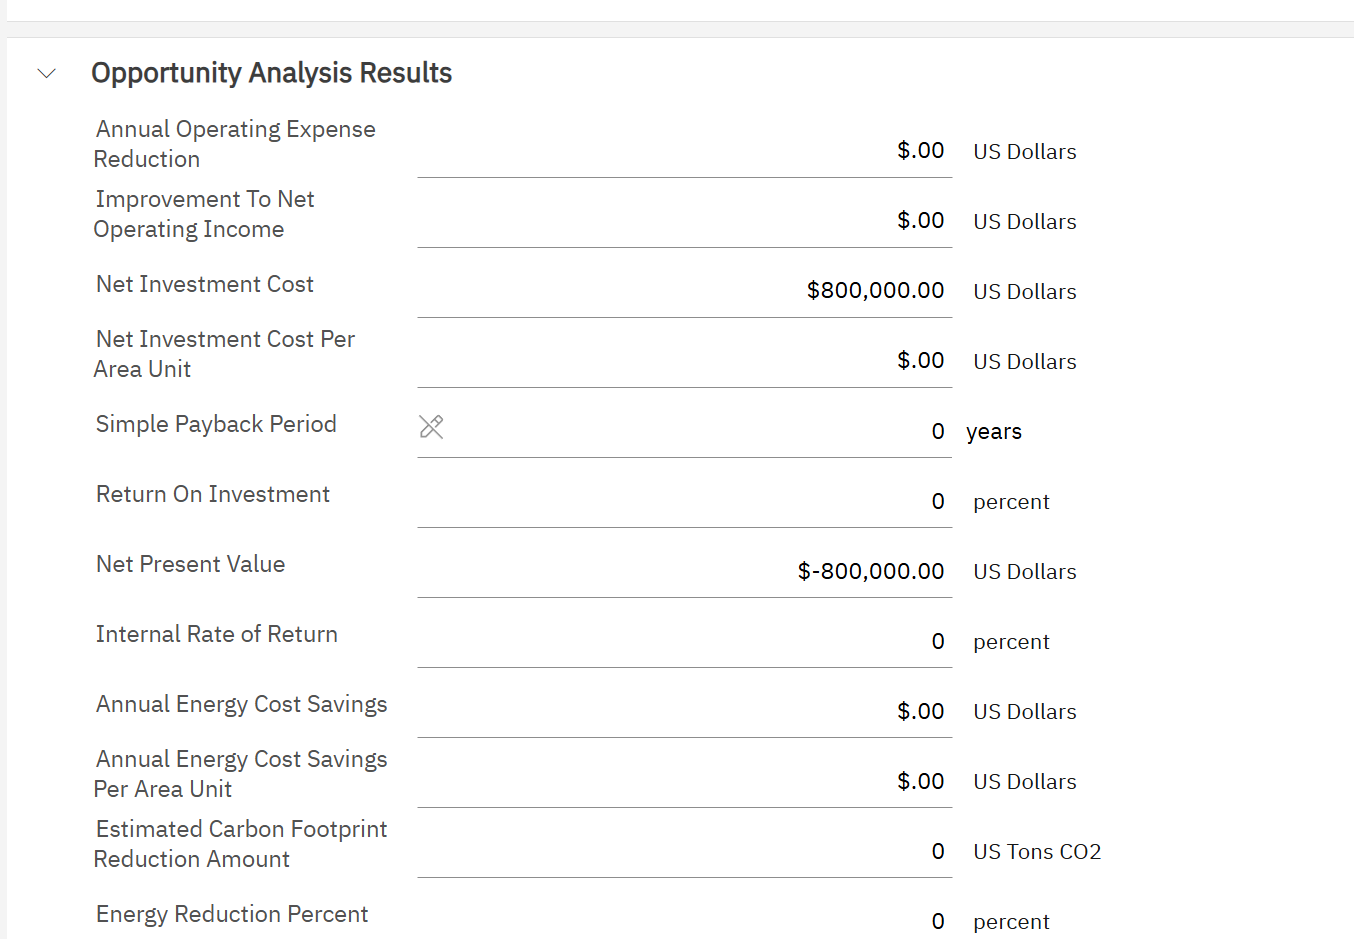
NPV adds up all future savings, discounted because money received later is worth less than money today, and subtracts the investment. NPV above zero: the project creates value. Below zero: it costs more than it returns.
A lesson hiding in plain sight. This solar request shows an NPV of −$800,000: exactly minus its cost. Not because solar is a bad idea, but because nobody has entered its savings yet, so MREF counts only the cost. Fill in the expected energy savings and rebates and the same screen turns a cost into an investment case. Requests compete on the numbers you give them, so give them the numbers.
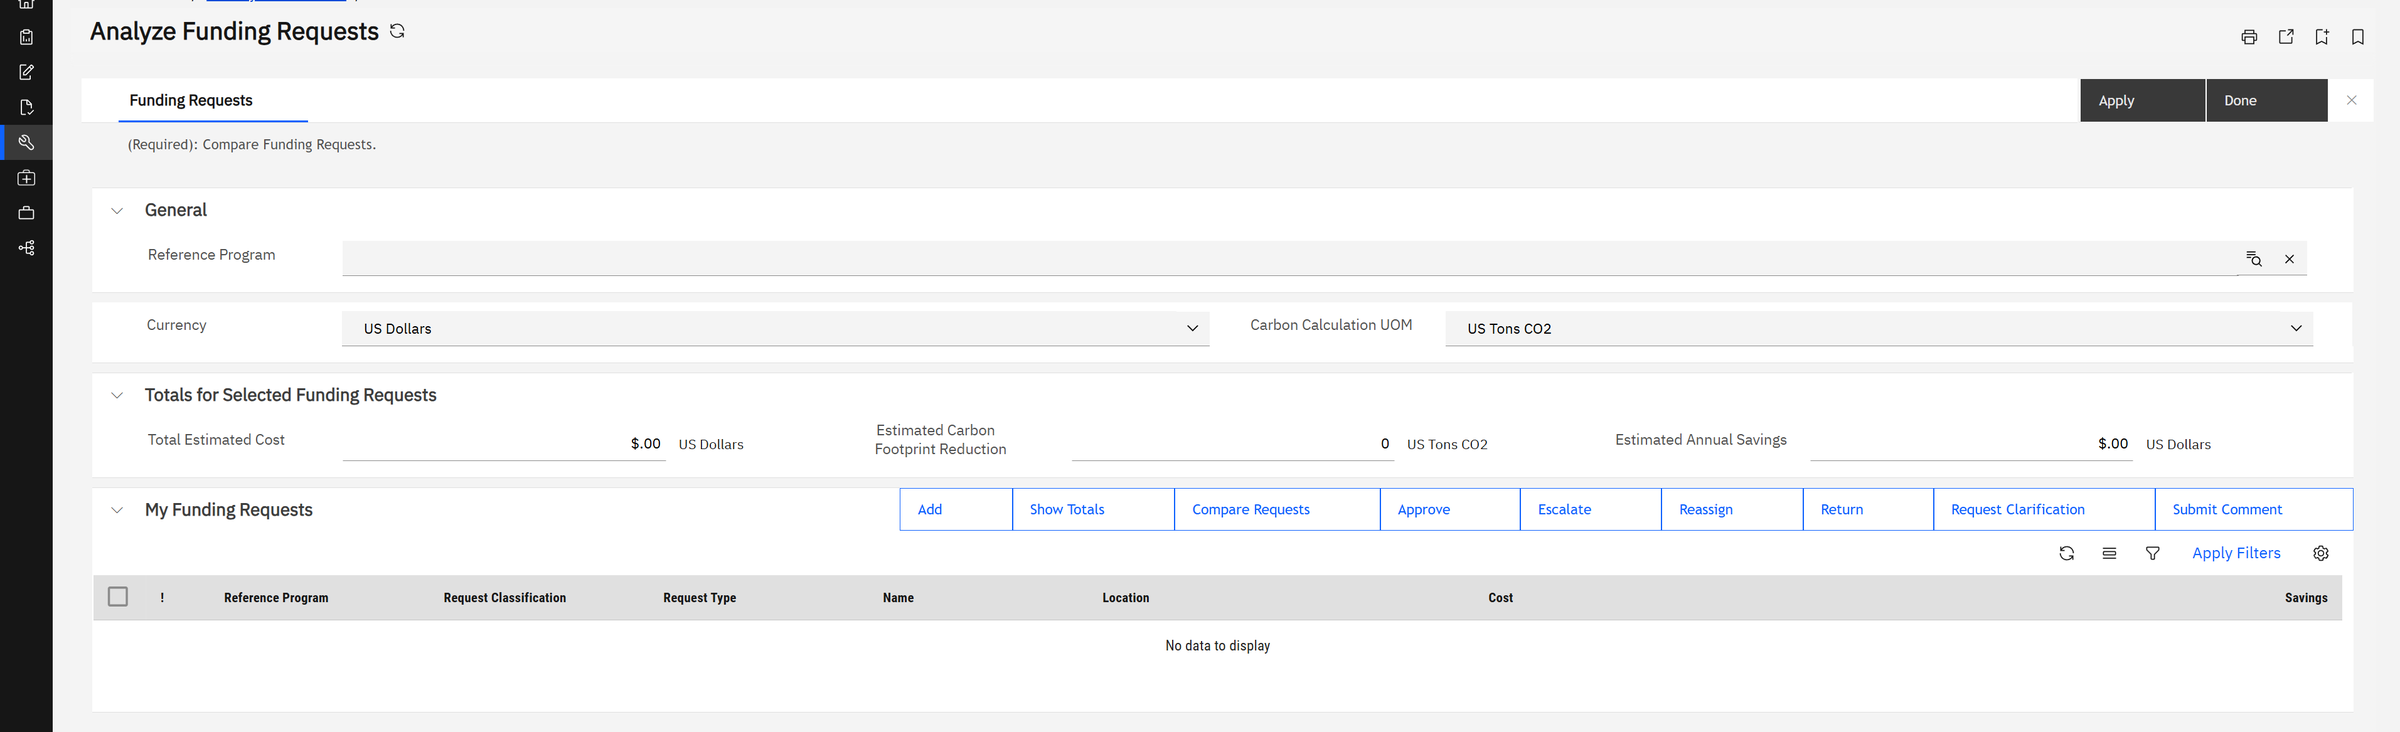
When it is time to choose, Analyze Funding Requests puts requests side by side, totals the cost, savings and carbon reduction of the ones you select, and records the decision on each: approve, escalate, return, or ask for clarification.
Chapter 4The program manager's desk
Now we switch chairs. The program manager does not look at buildings first. They look at money: which programs they own, how much is left, and which projects are drifting.
Three levels, like a family budget: a funding source is where money comes from (the capital budget, a grant). A program is a pot of money with a purpose and a time span, such as "renew the Charlotte campus 2020–2030"; it can contain sub-programs. A project is one piece of work that draws money from a program, year by year.
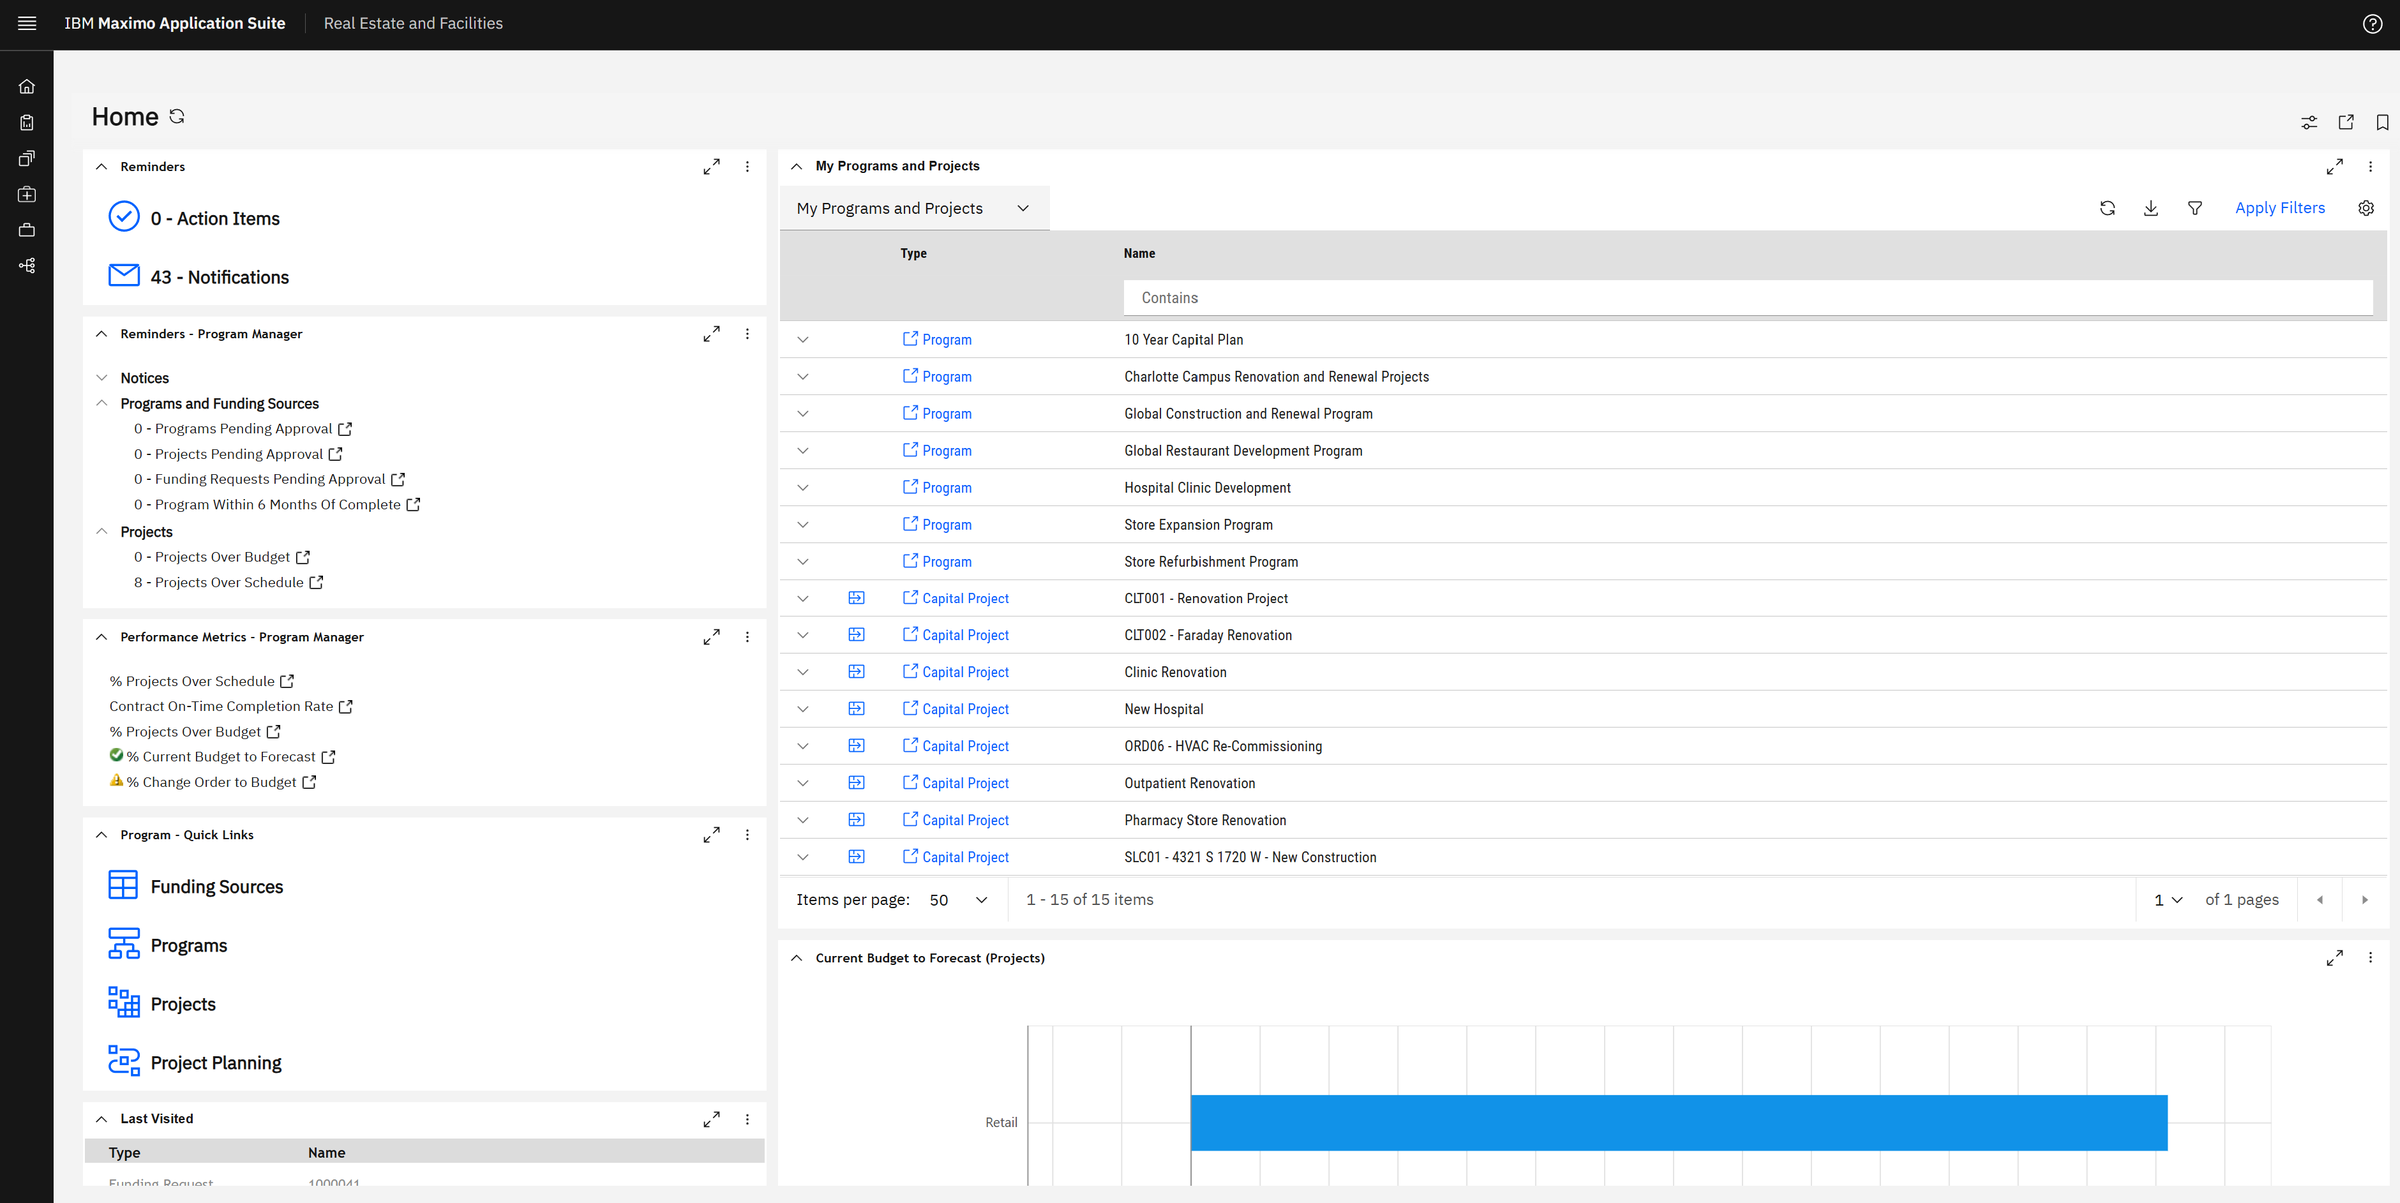
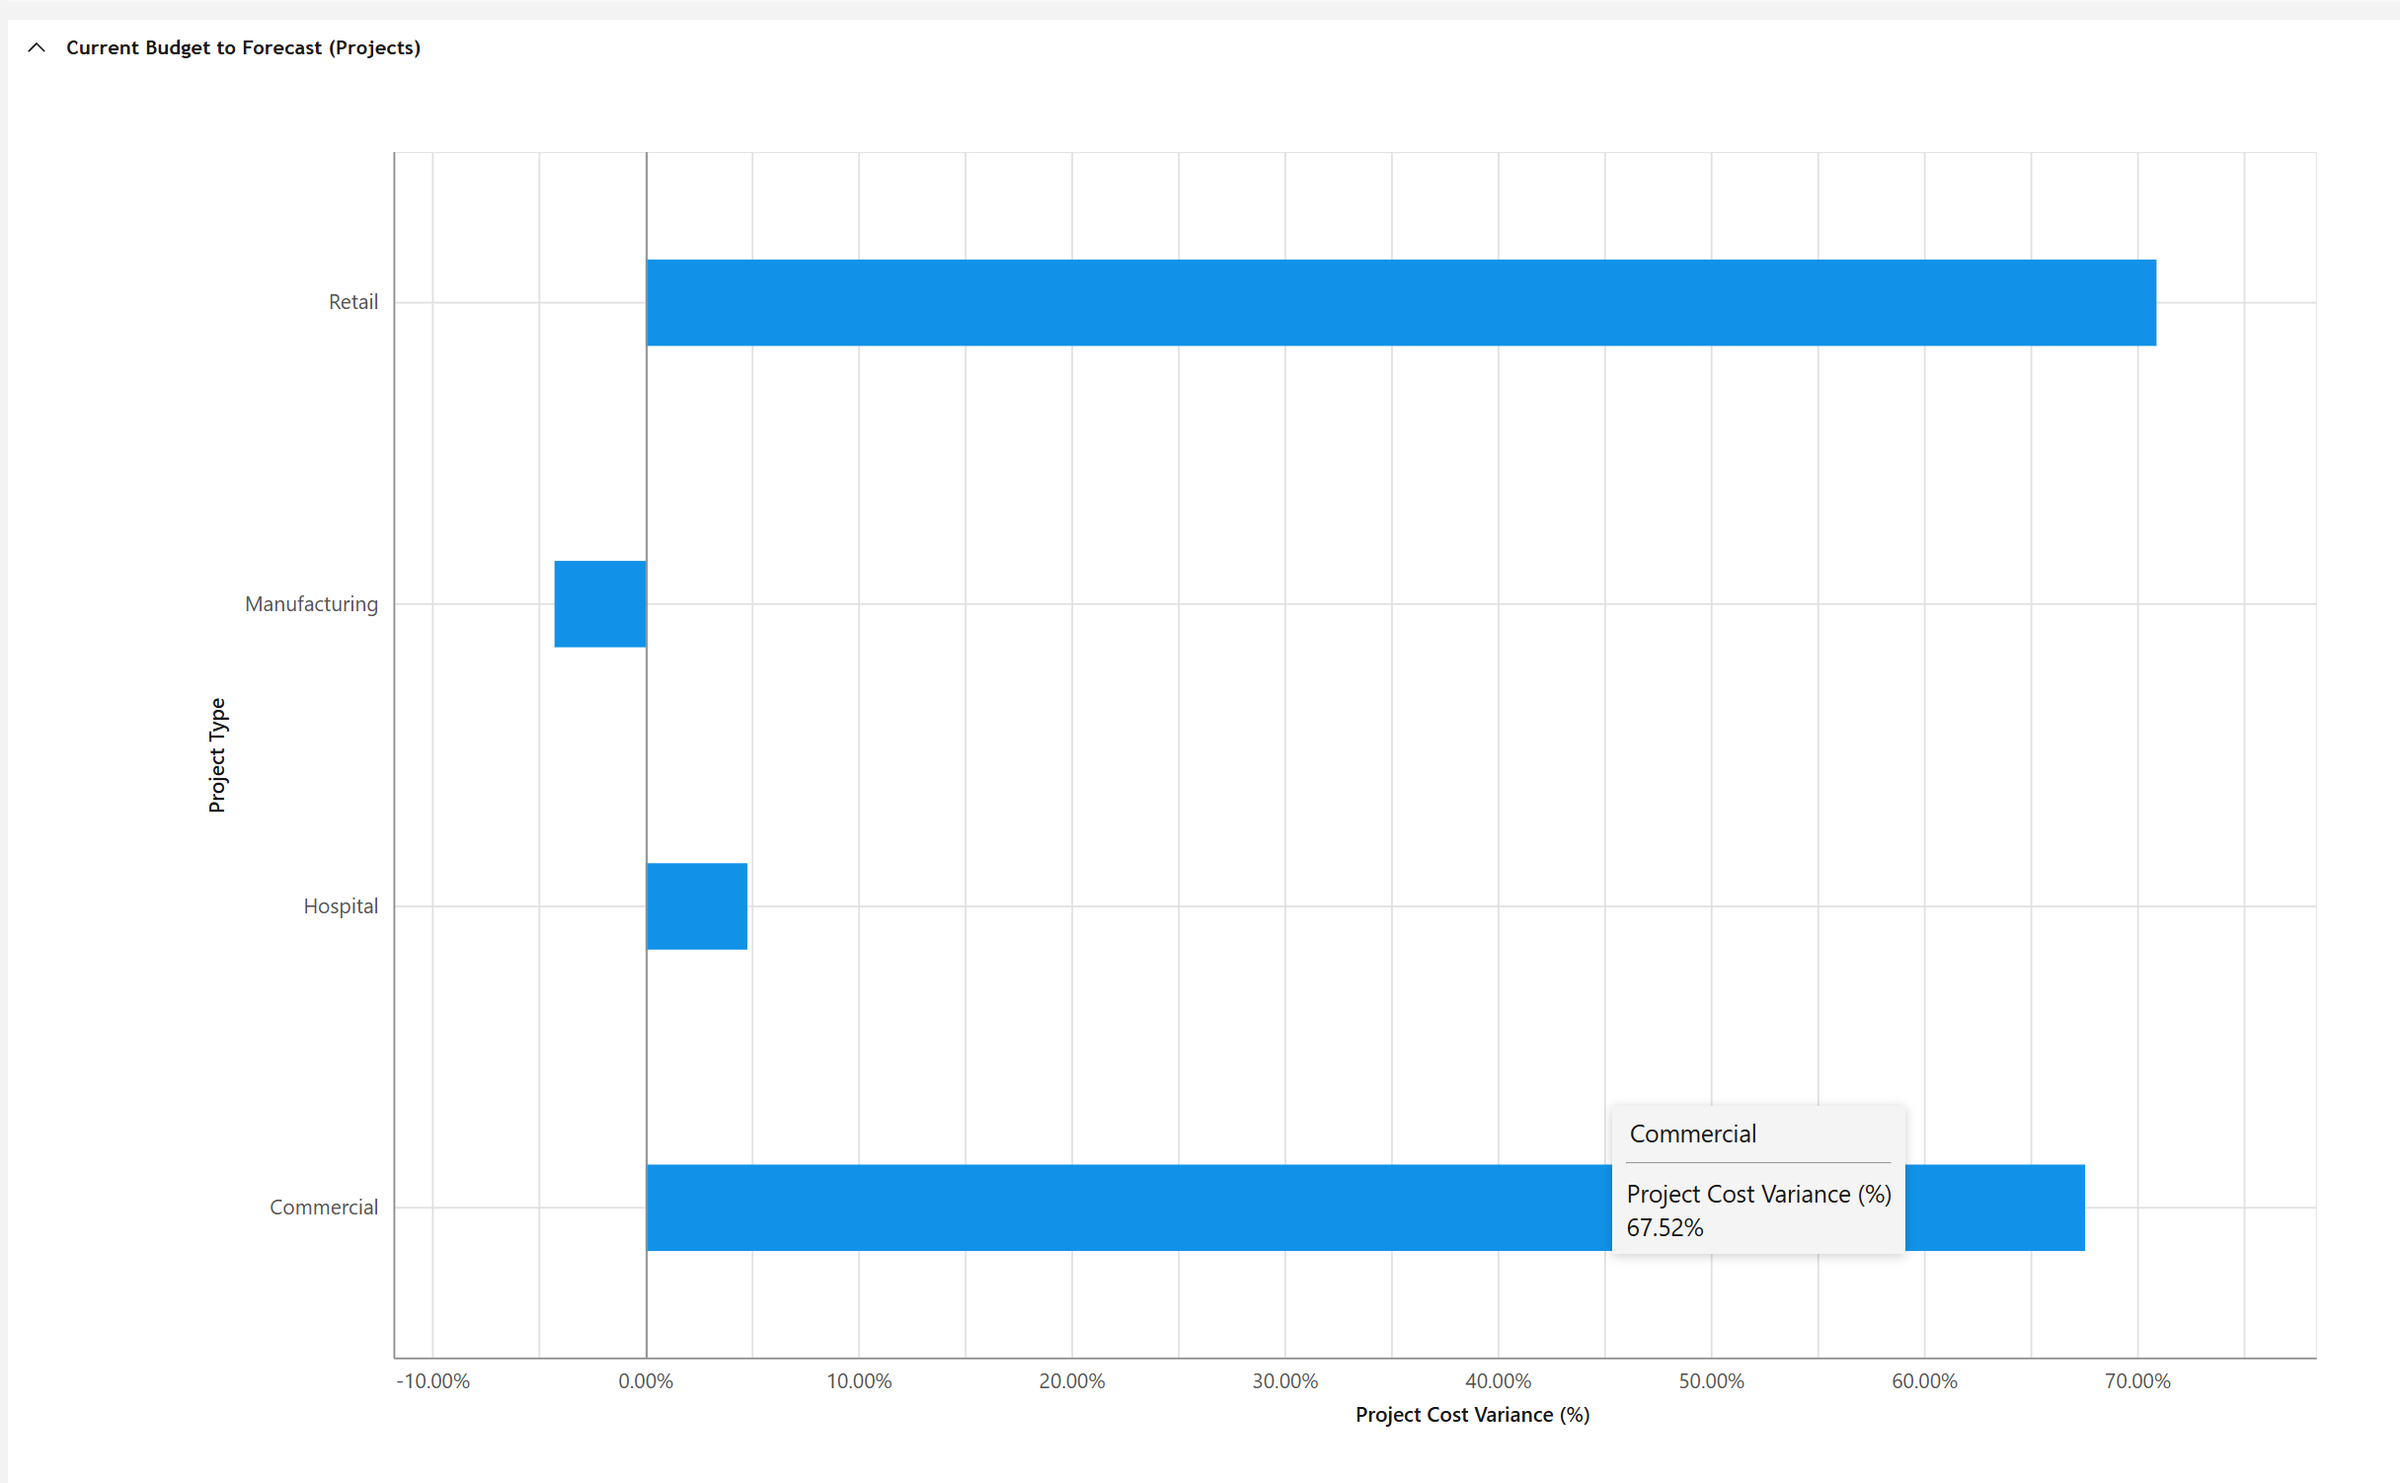
The chart above is an early-warning signal: a large positive variance means the forecast cost is well above the budget for that type of project. A program manager acts on it before it becomes an overspend.
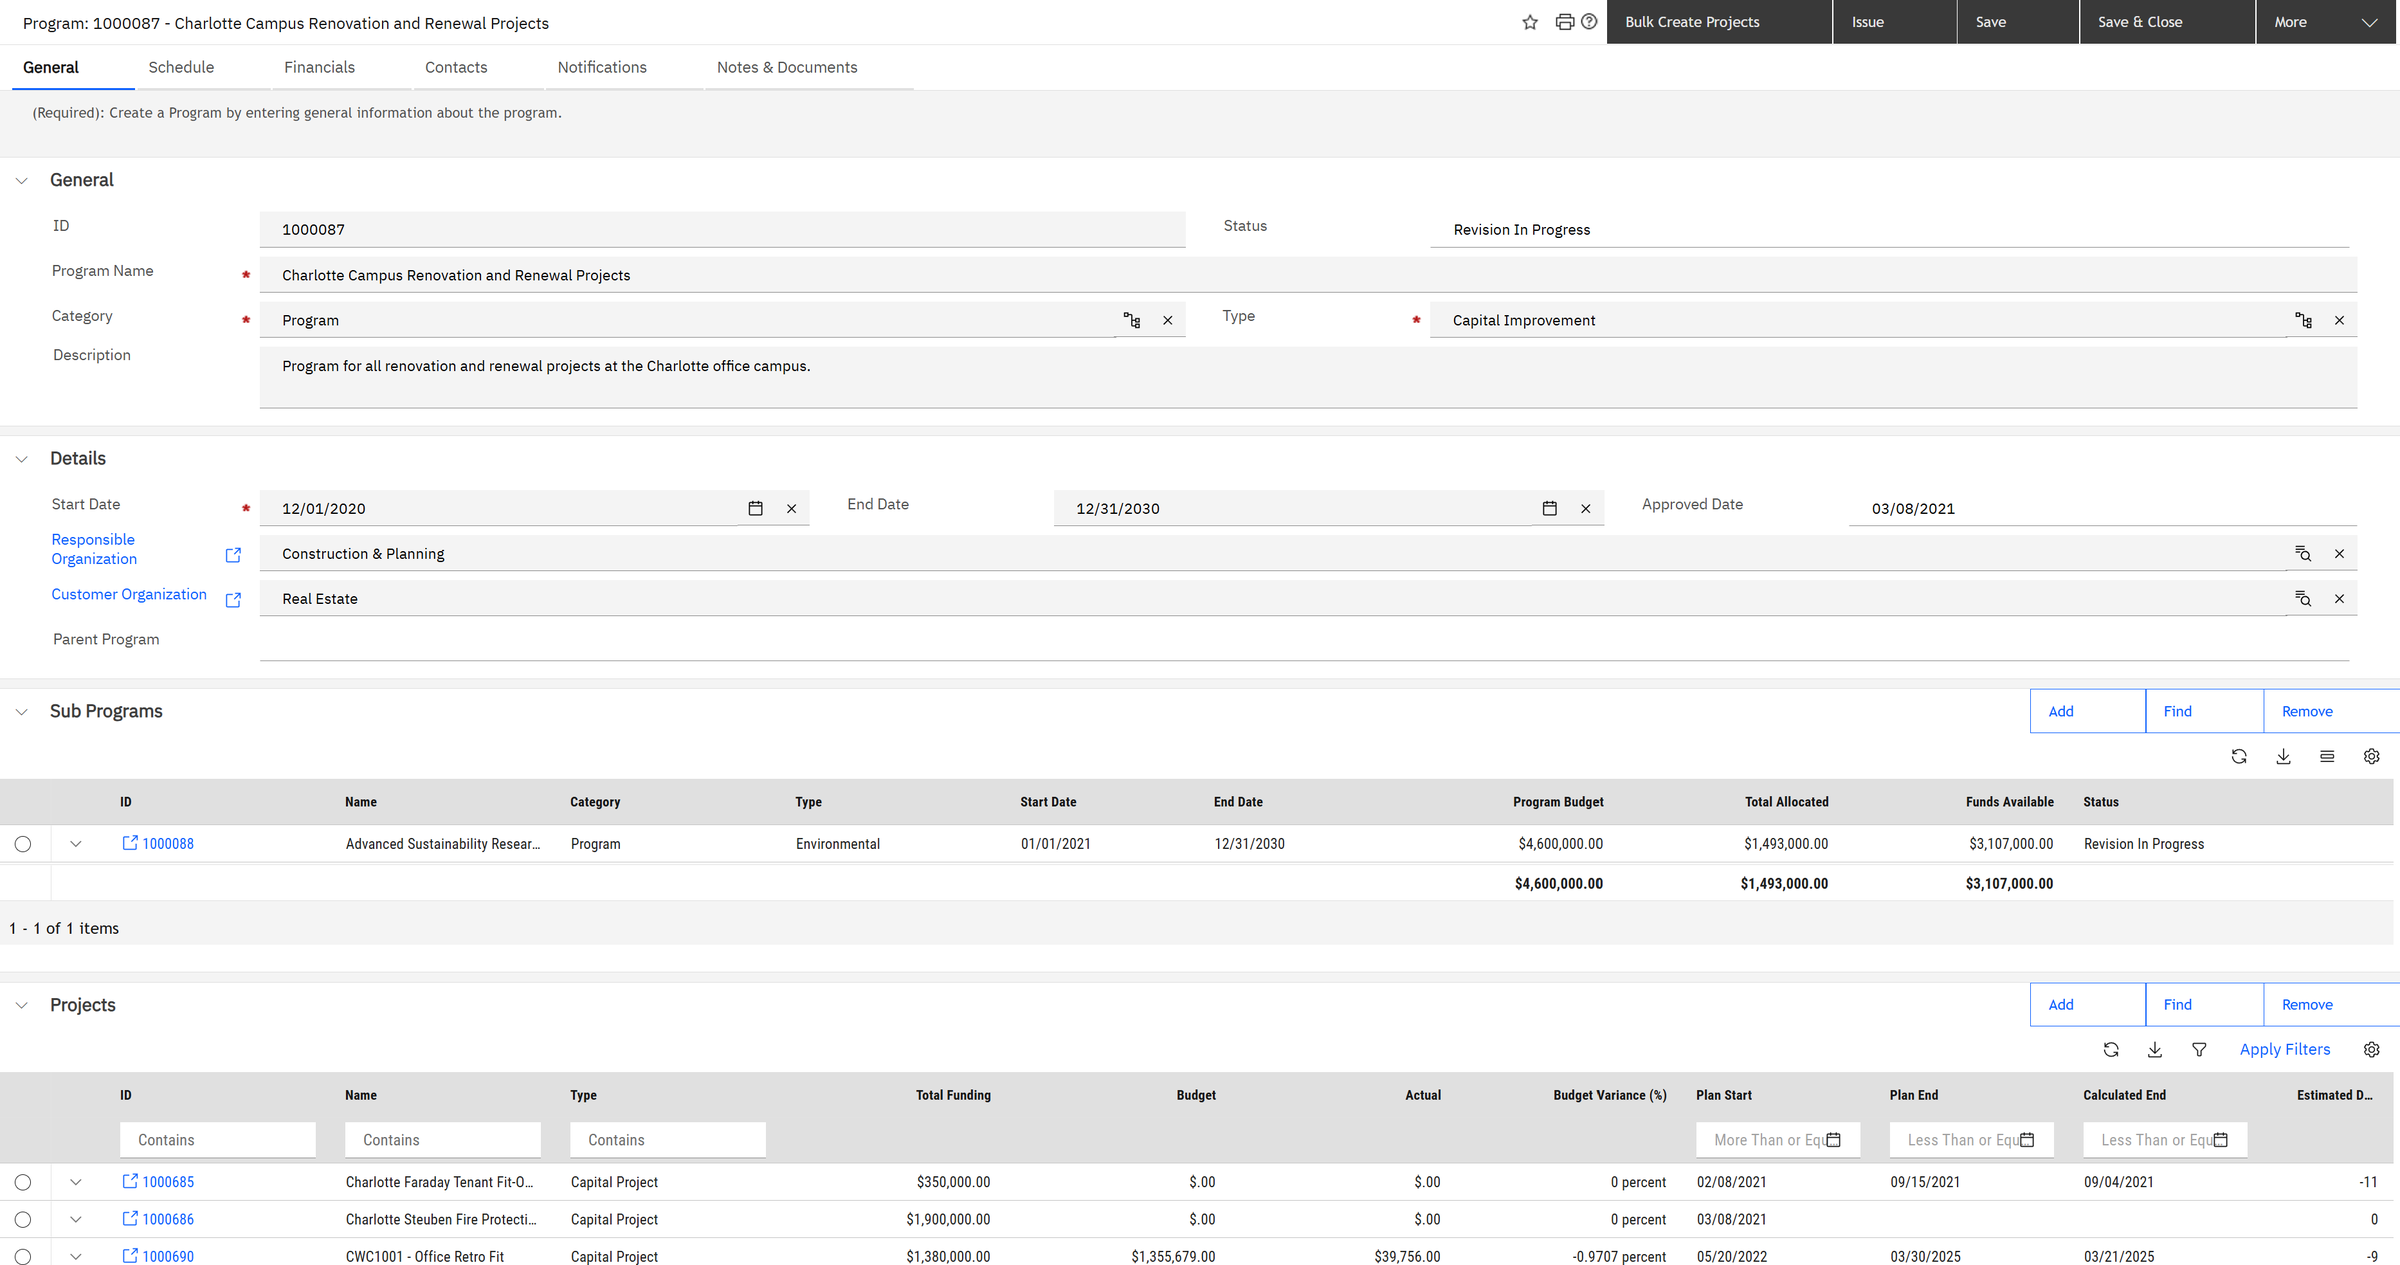
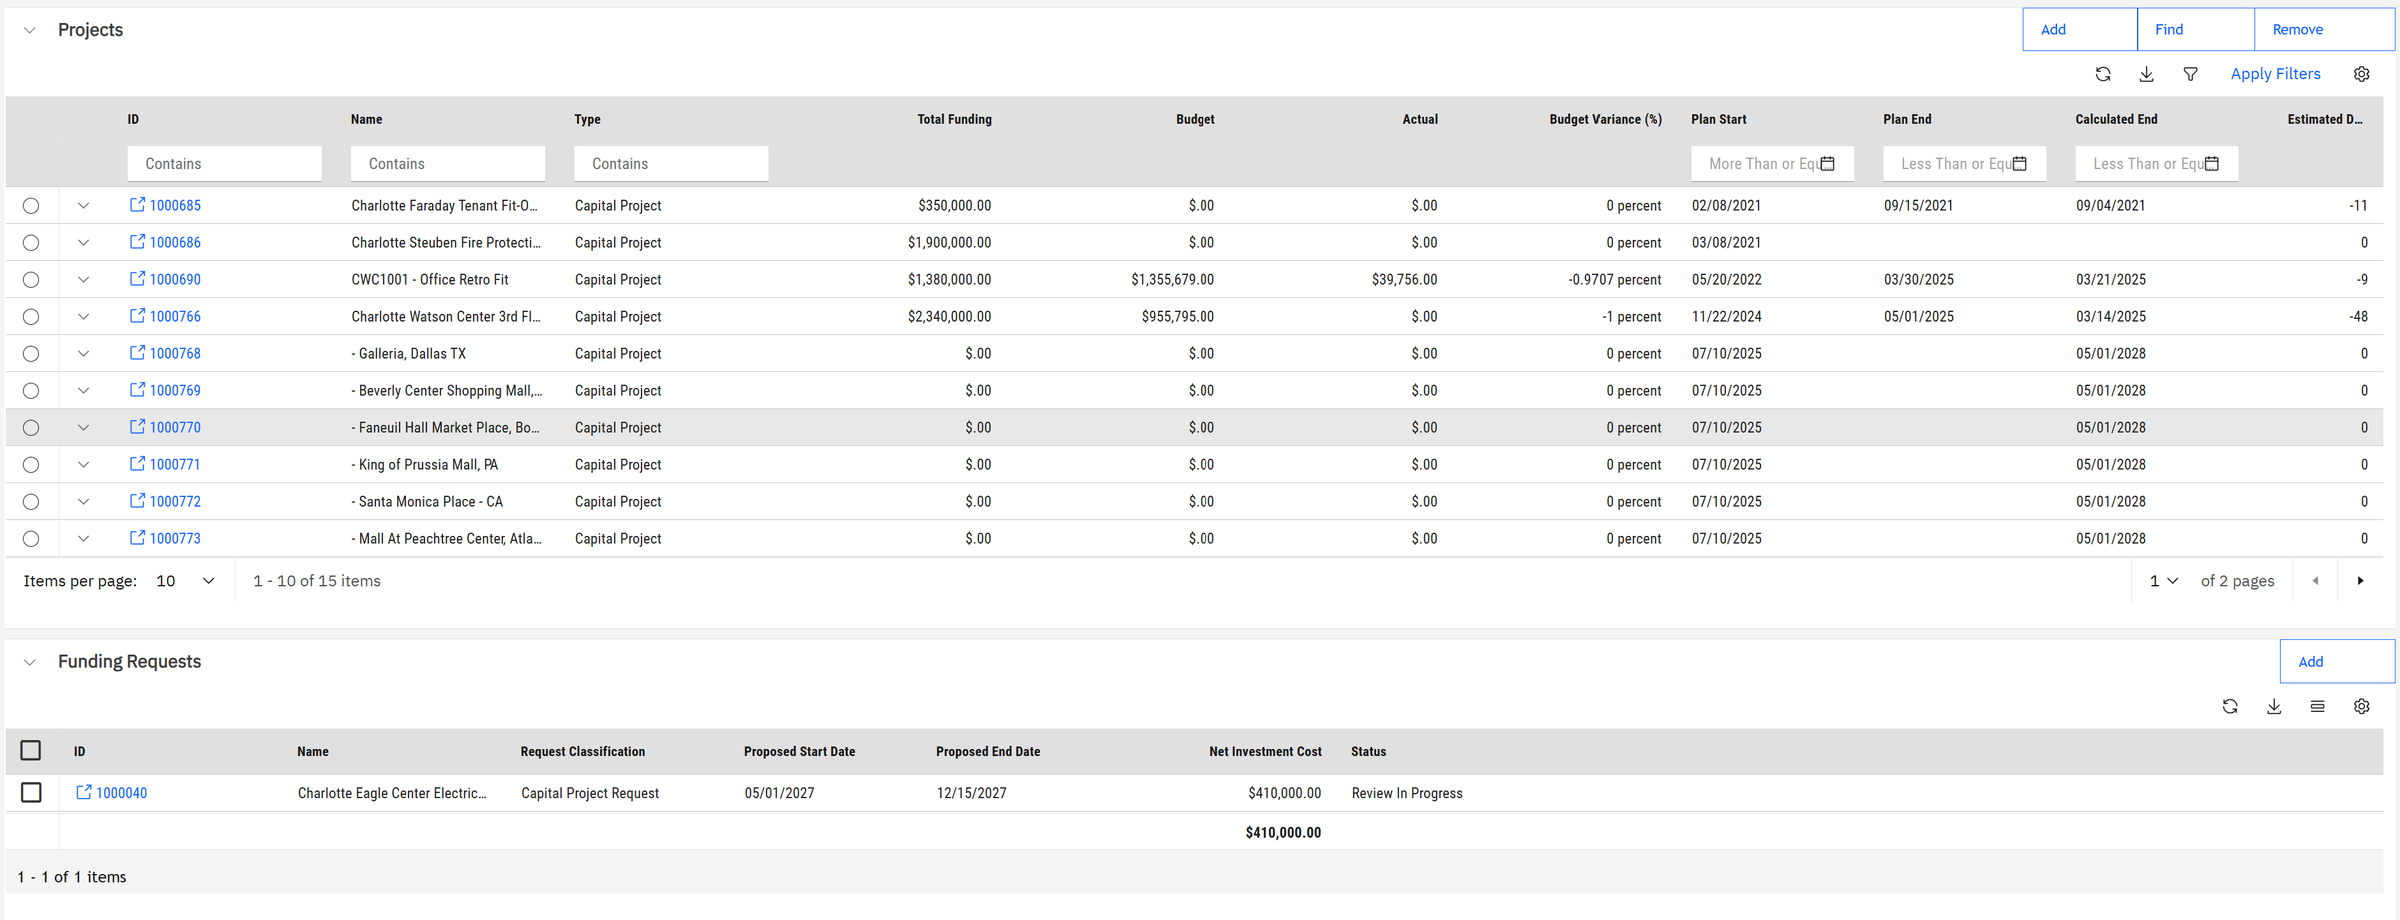
Our building belongs to the Charlotte Campus Renovation and Renewal program.
The Financials tab works like a bank statement for the program. Read it letter by letter:
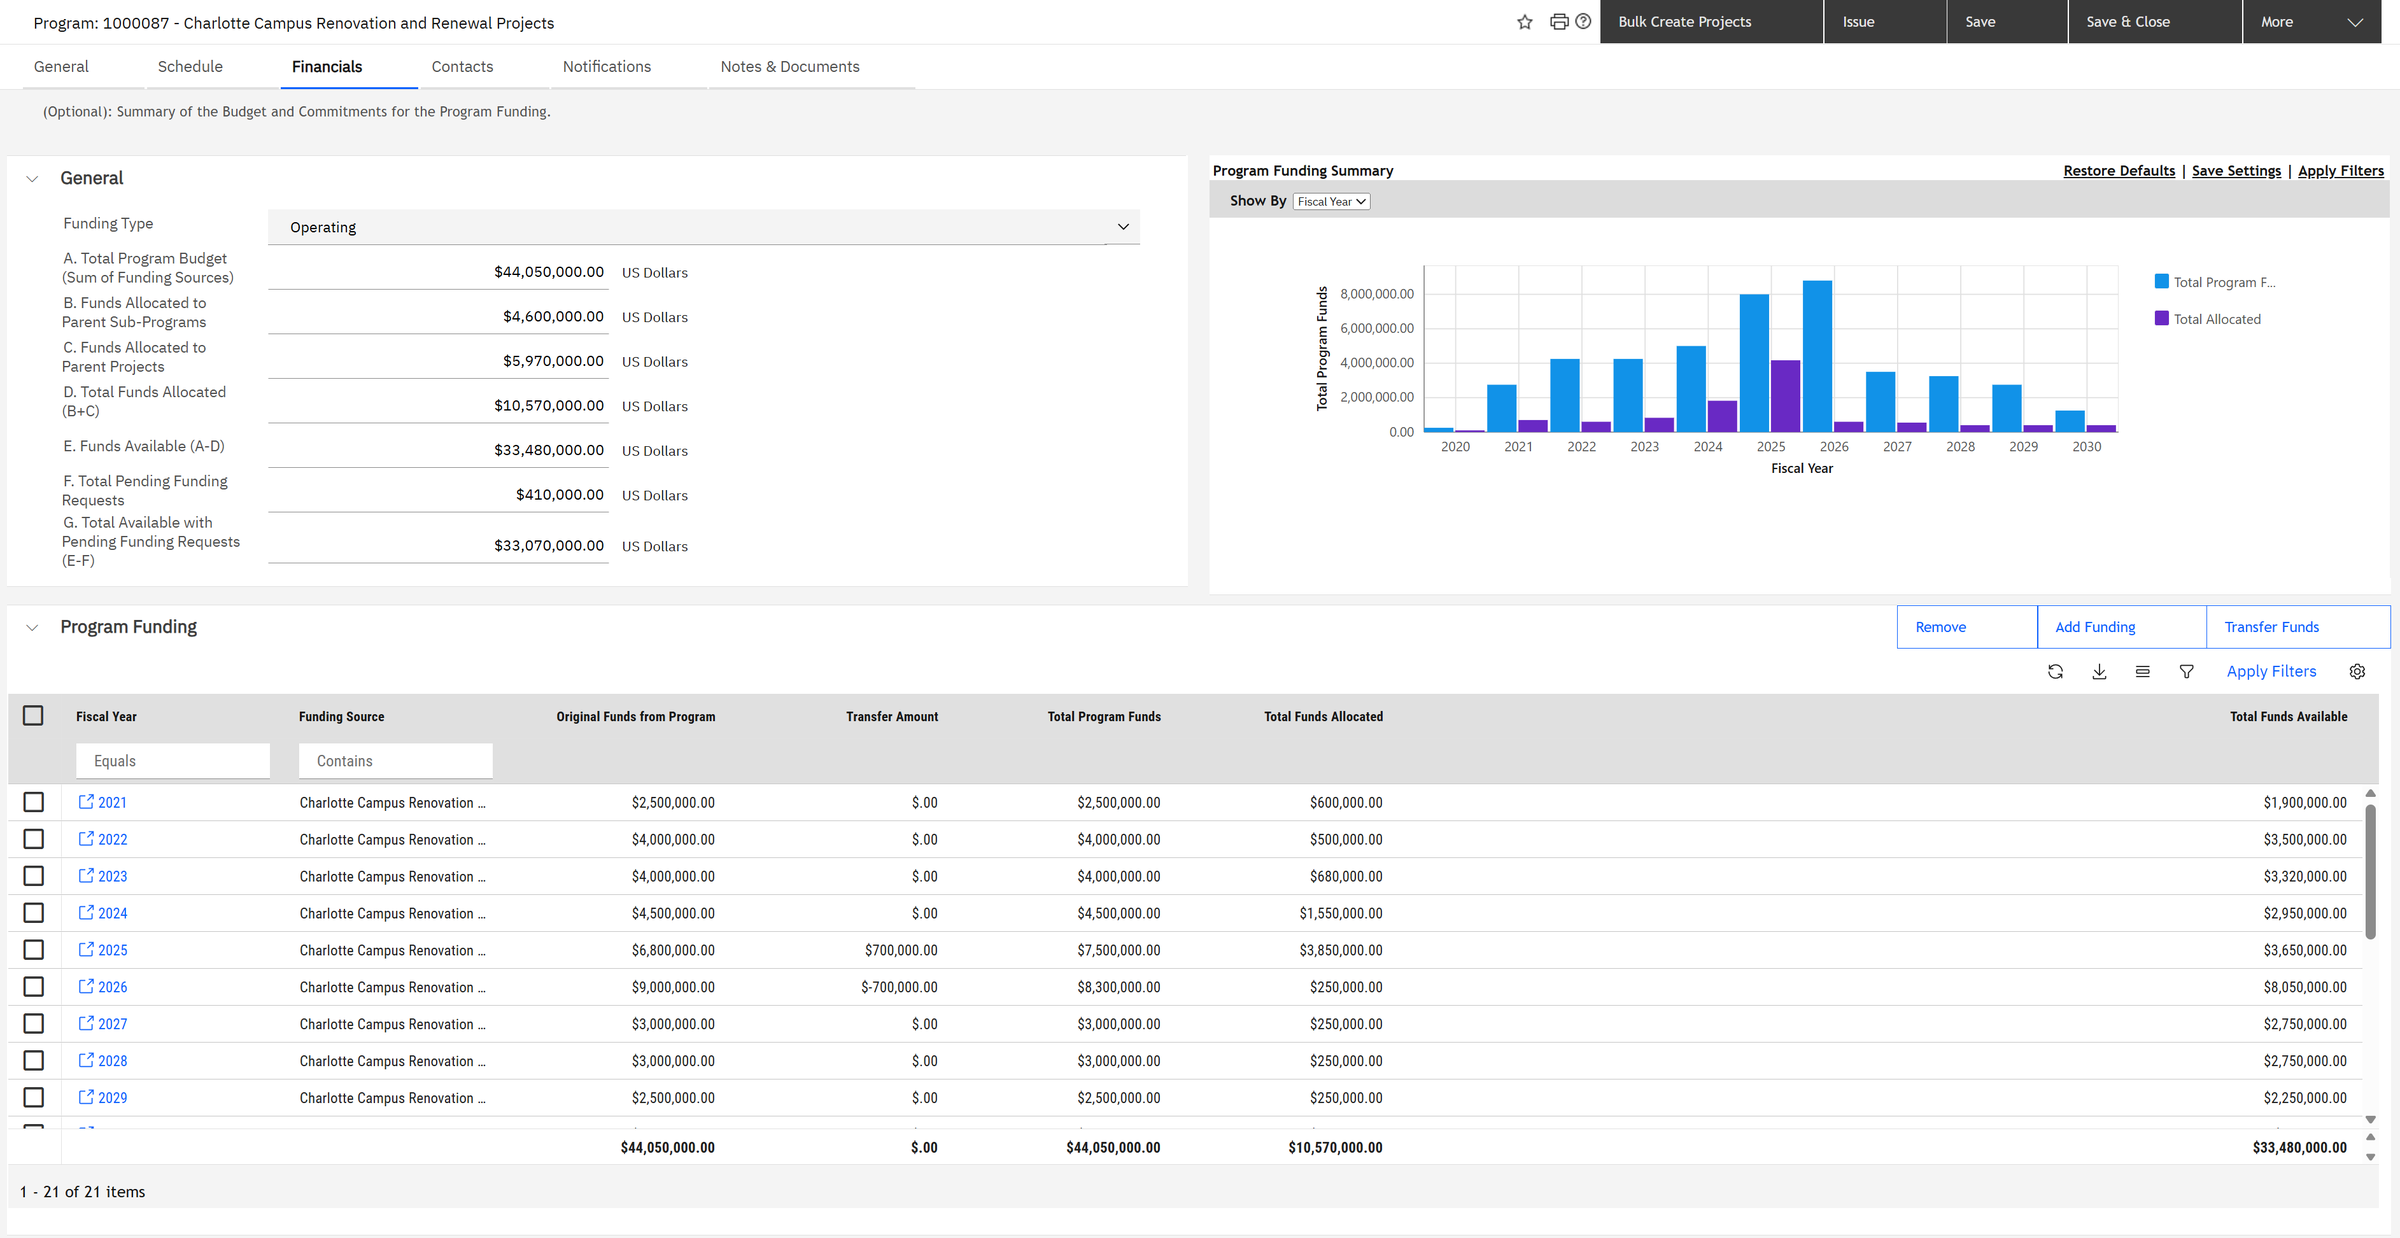
A. Total program budget: $44,050,000
D. Total allocated = B (to sub-programs, $4,600,000) + C (to projects, $5,970,000) = $10,570,000
E. Available = A − D = 44,050,000 − 10,570,000 = $33,480,000
G. Available after pending requests = E − F ($410,000) = $33,070,000
Notice the transfer: $700,000 moved from 2026 into 2025, because the work came earlier than planned. Money follows reality, and the move is on record.
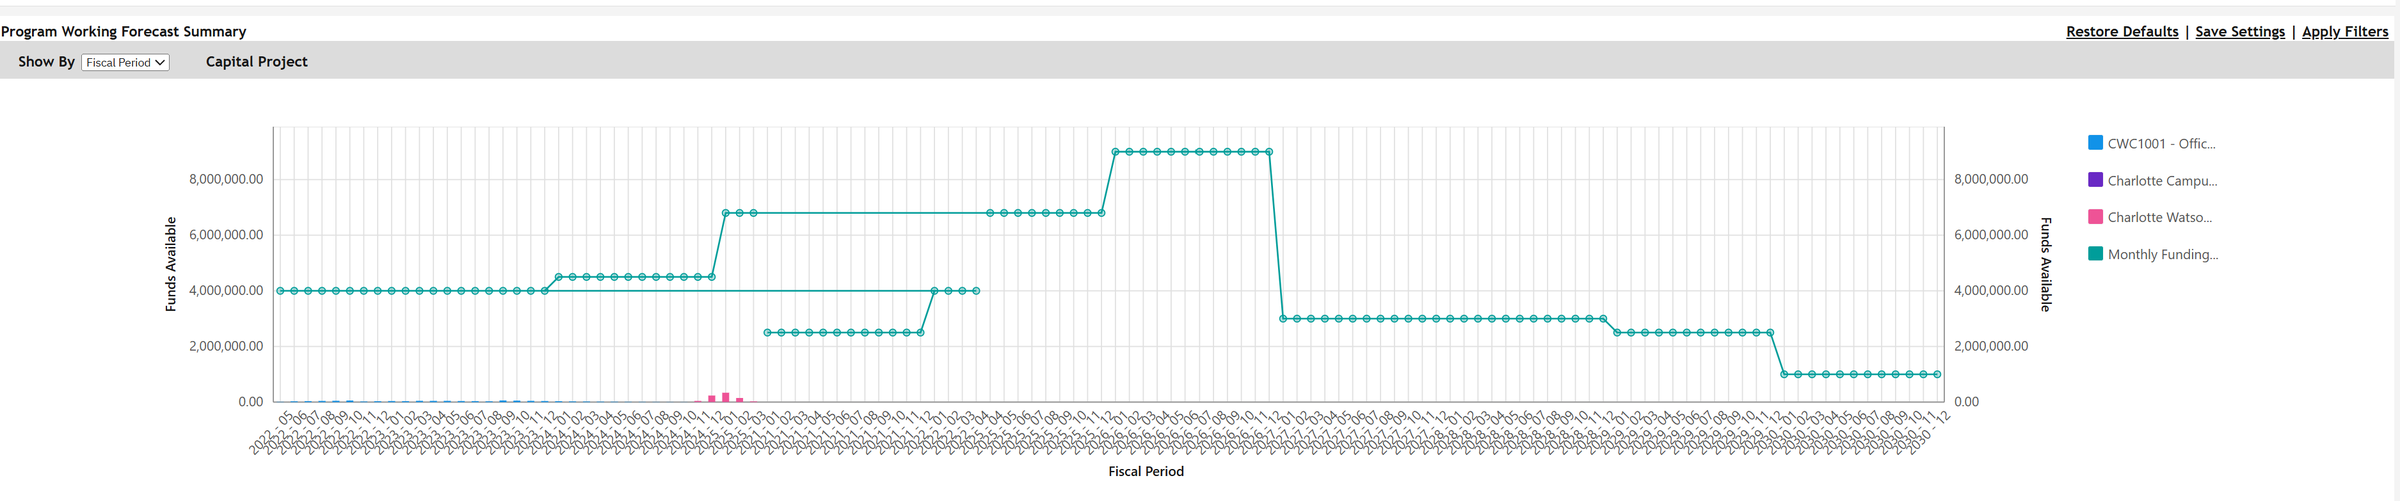
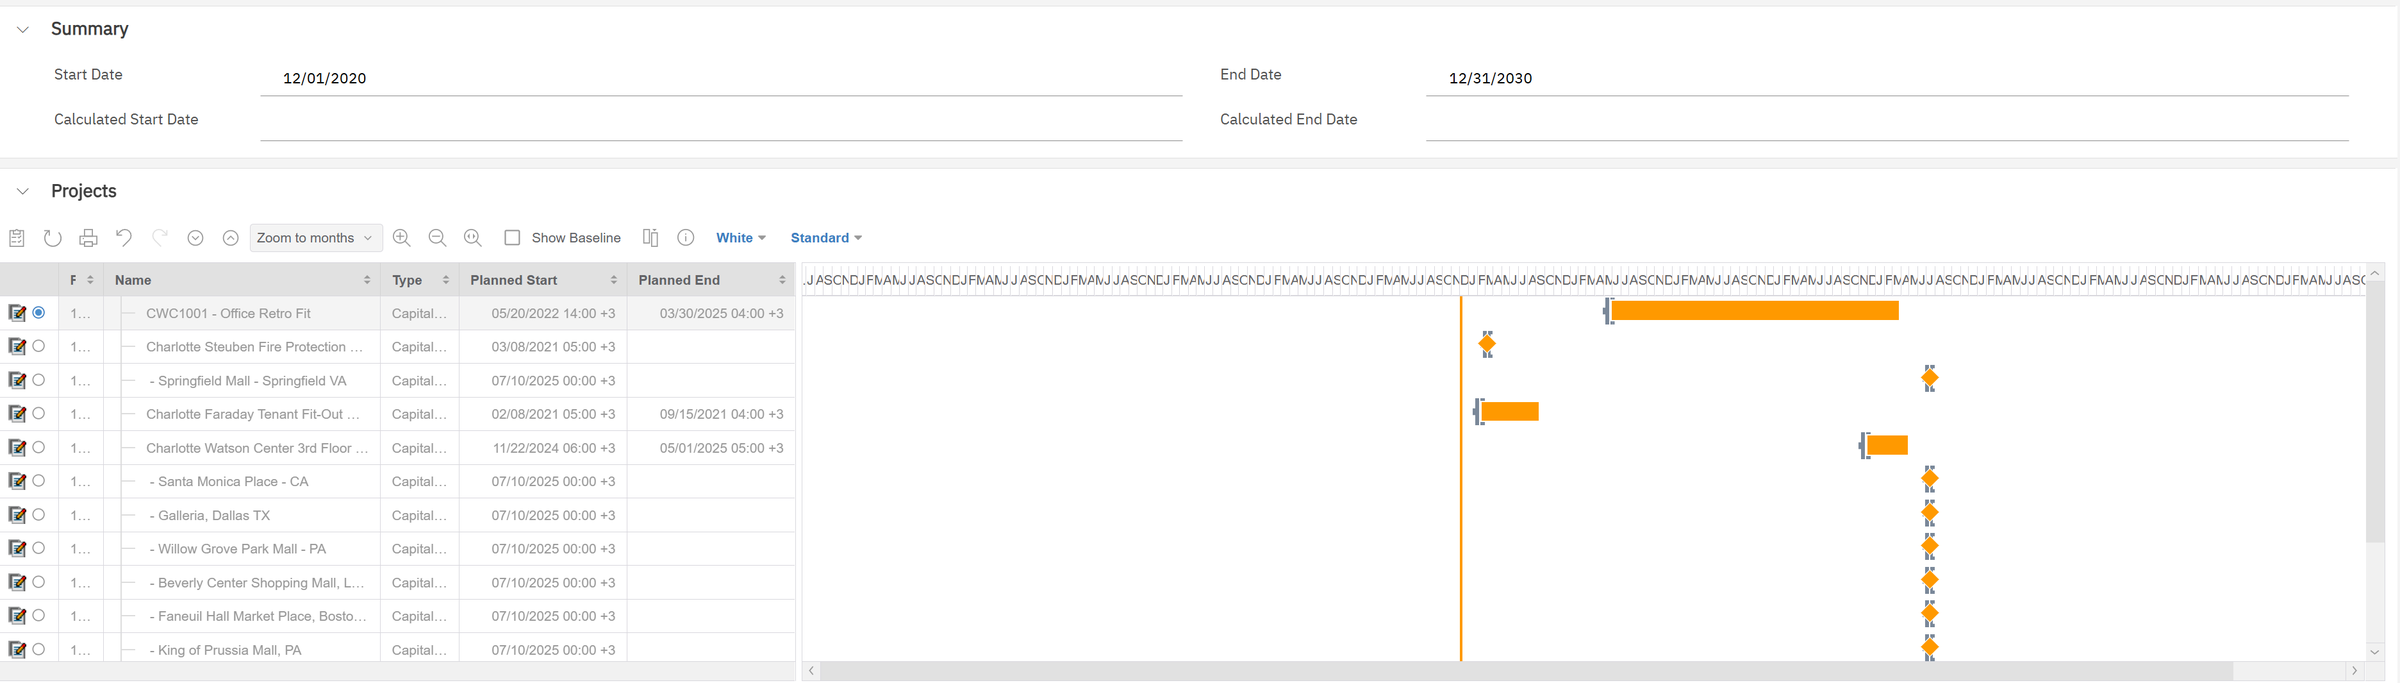
Energy work has its own sub-program, Advanced Sustainability Research Projects: $4.6 million of budget, $1.49 million allocated, $3.11 million still free. On its project list we find the end of our story.
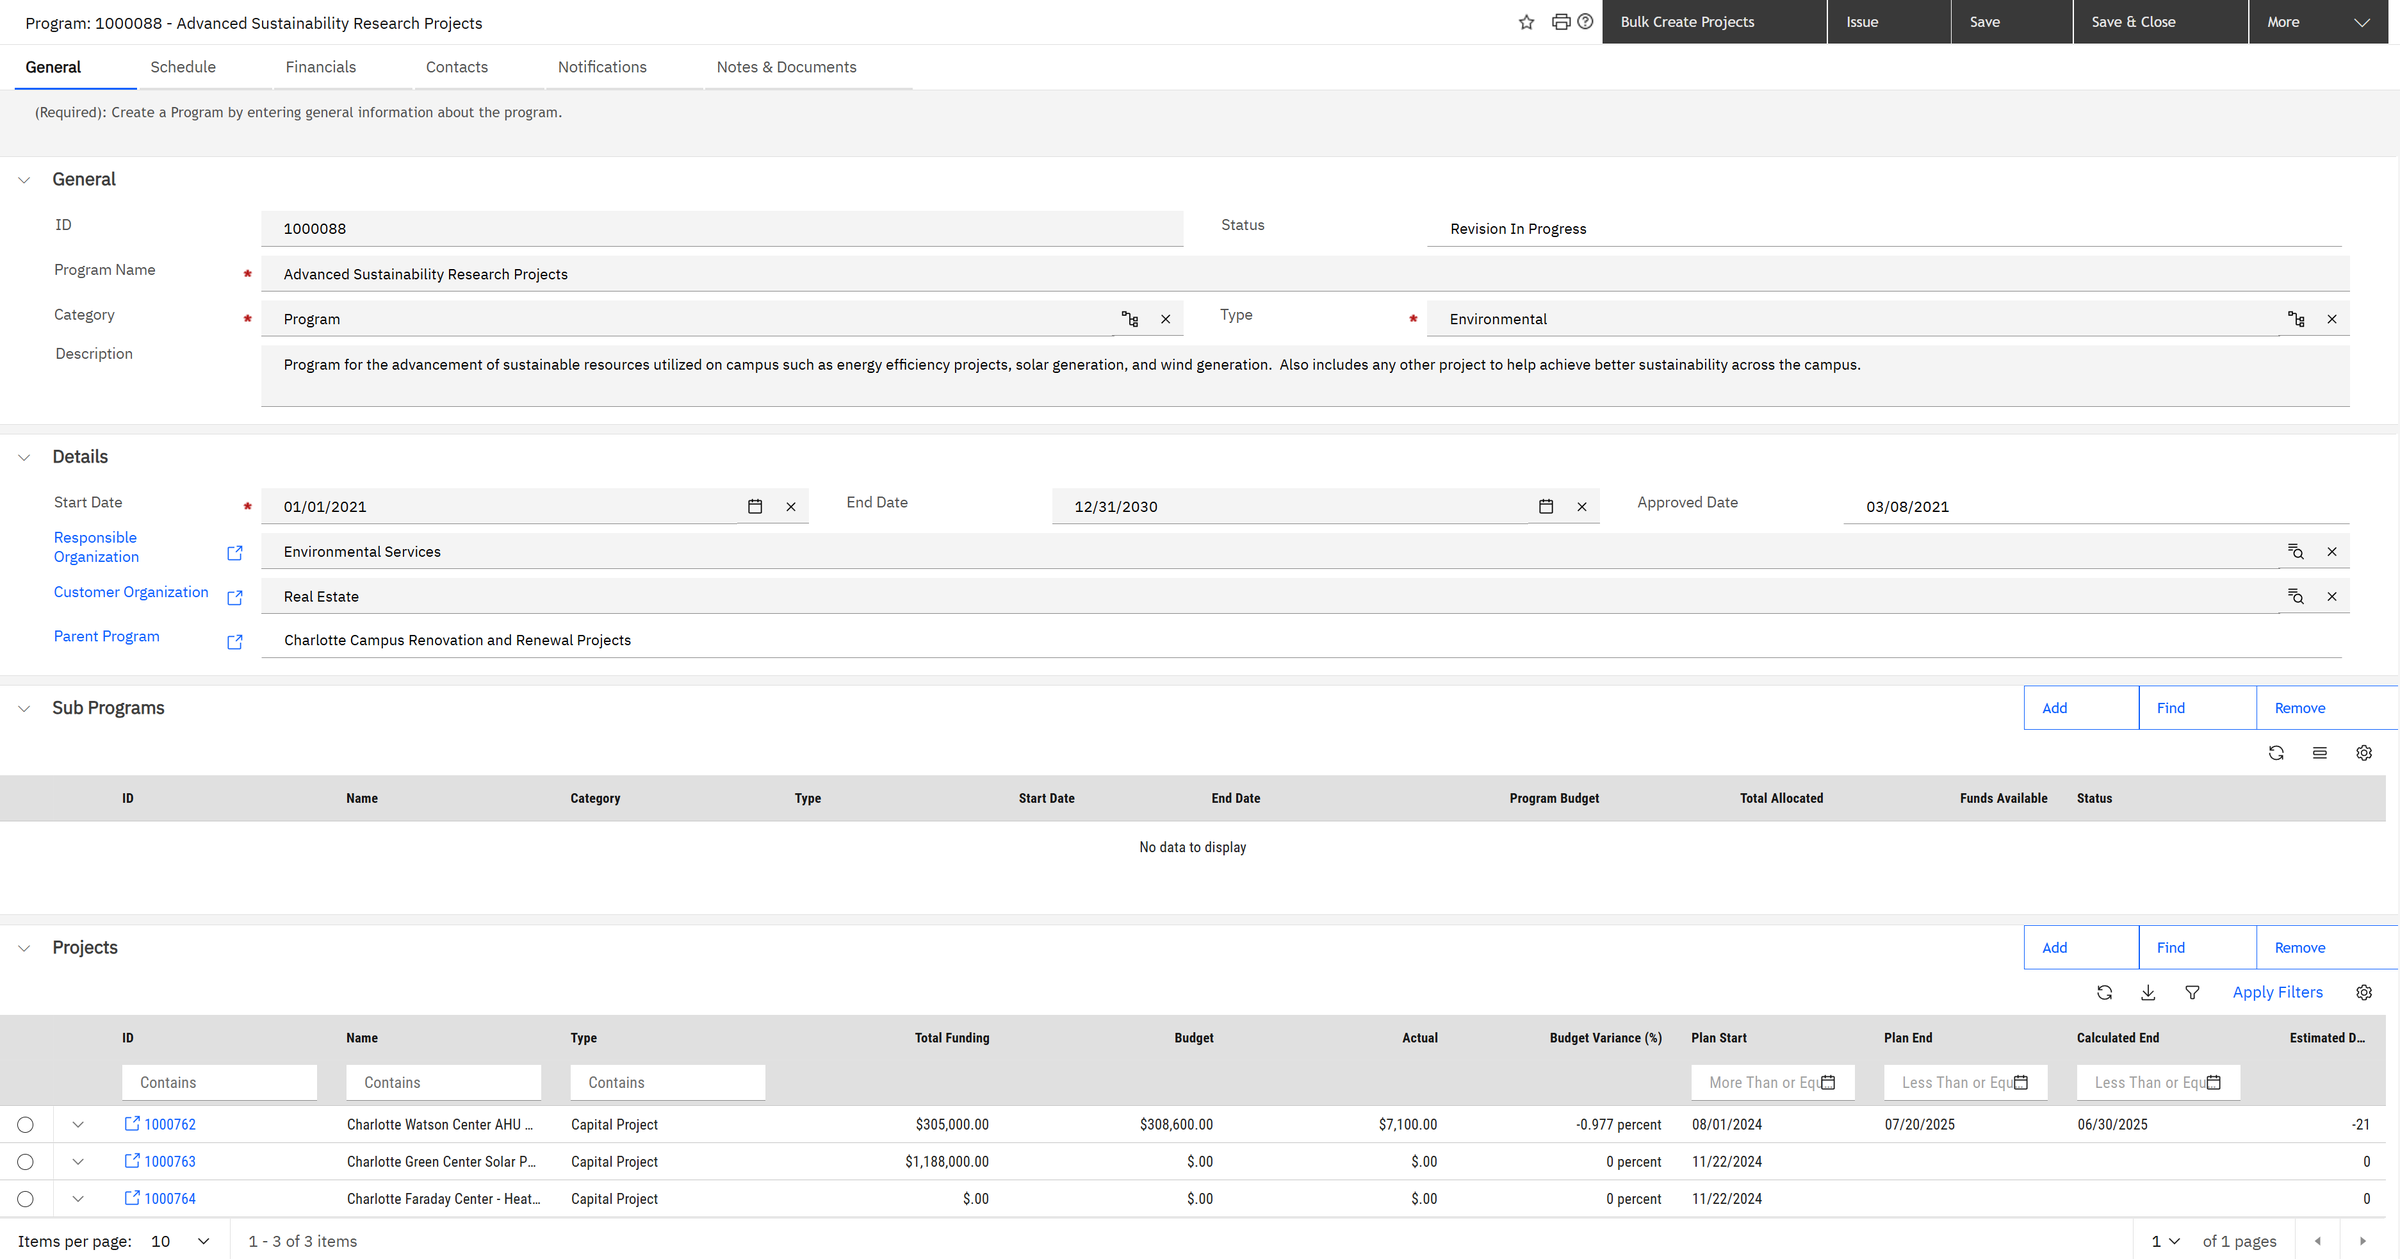
pprogram. Projects › Programs opens the programs;
Projects › Funding Sources the money behind them; Projects › Capital the projects.Chapter 5The plan becomes a project
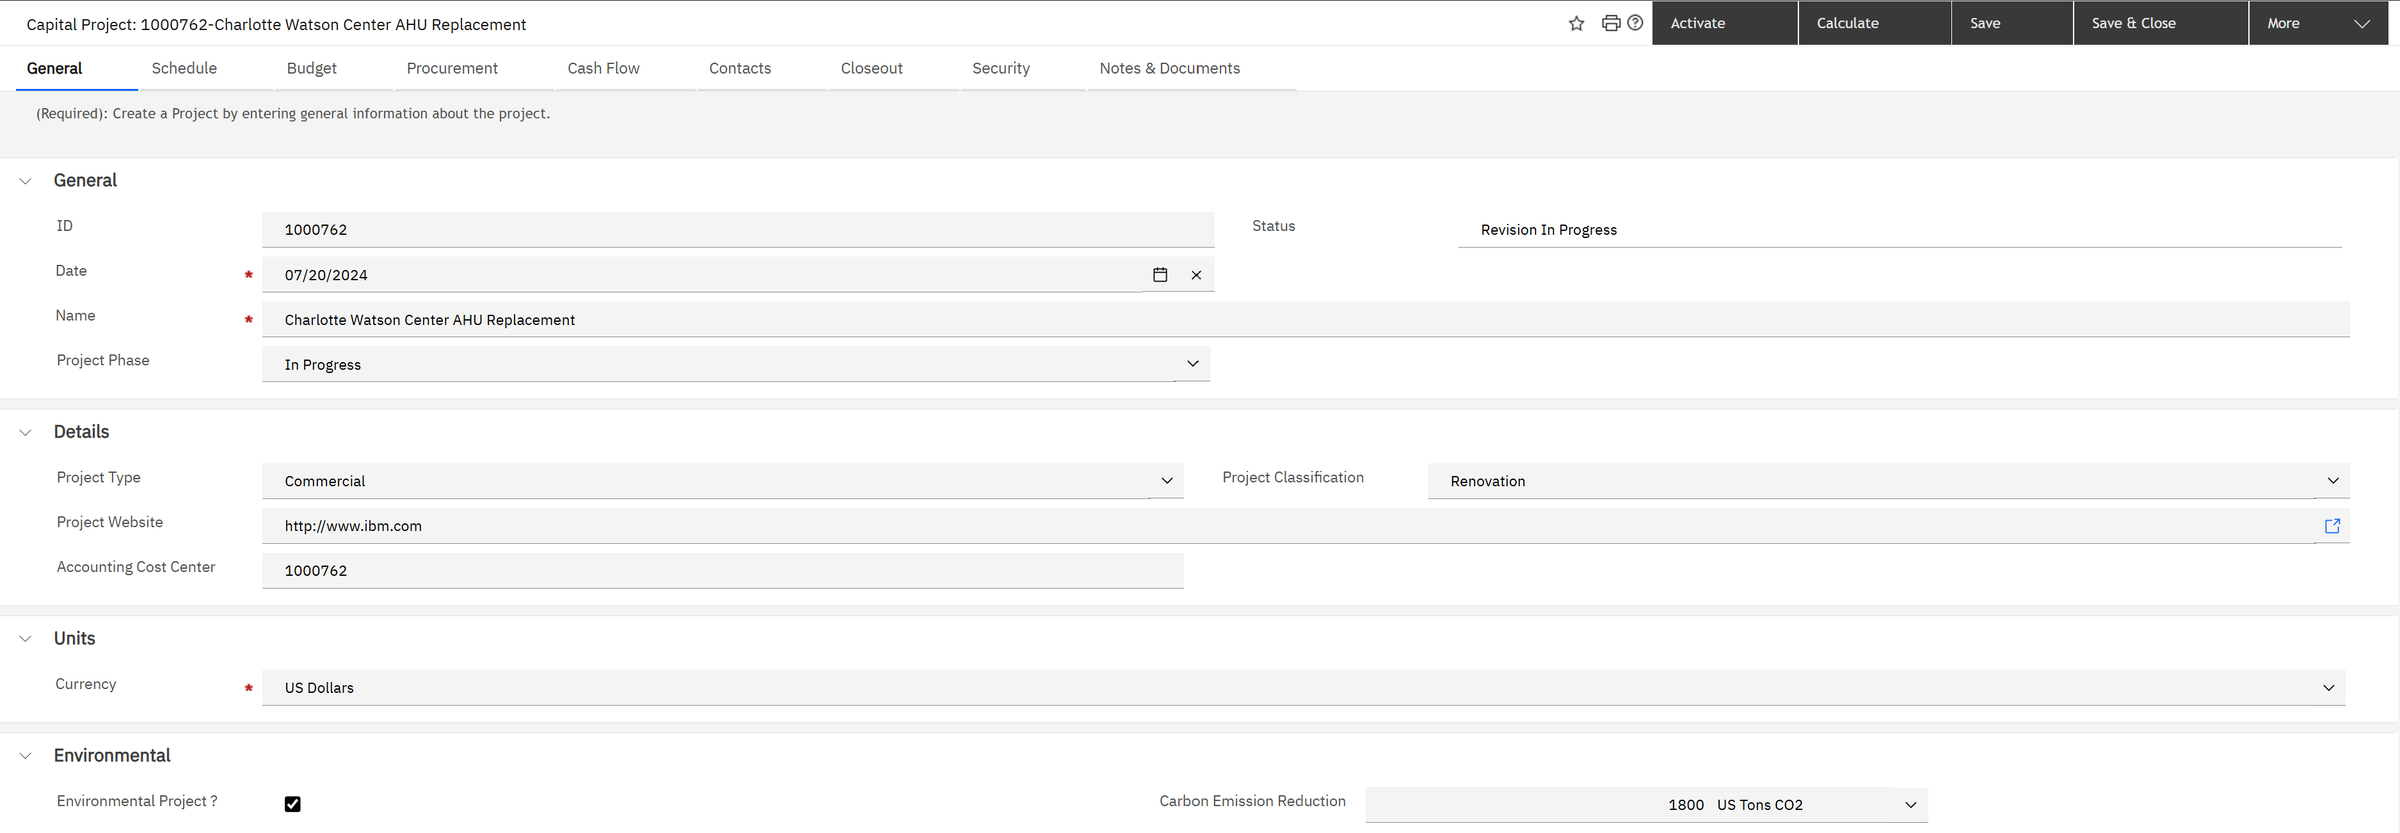
Charlotte Watson Center AHU Replacement. An AHU, or air handling unit, is the big box that moves and conditions the air: the heart of the HVAC system. This is what a need looks like once it is funded: a capital project with an owner, a location, a schedule, a budget and even a carbon target (1,800 US tons of CO2 a year).
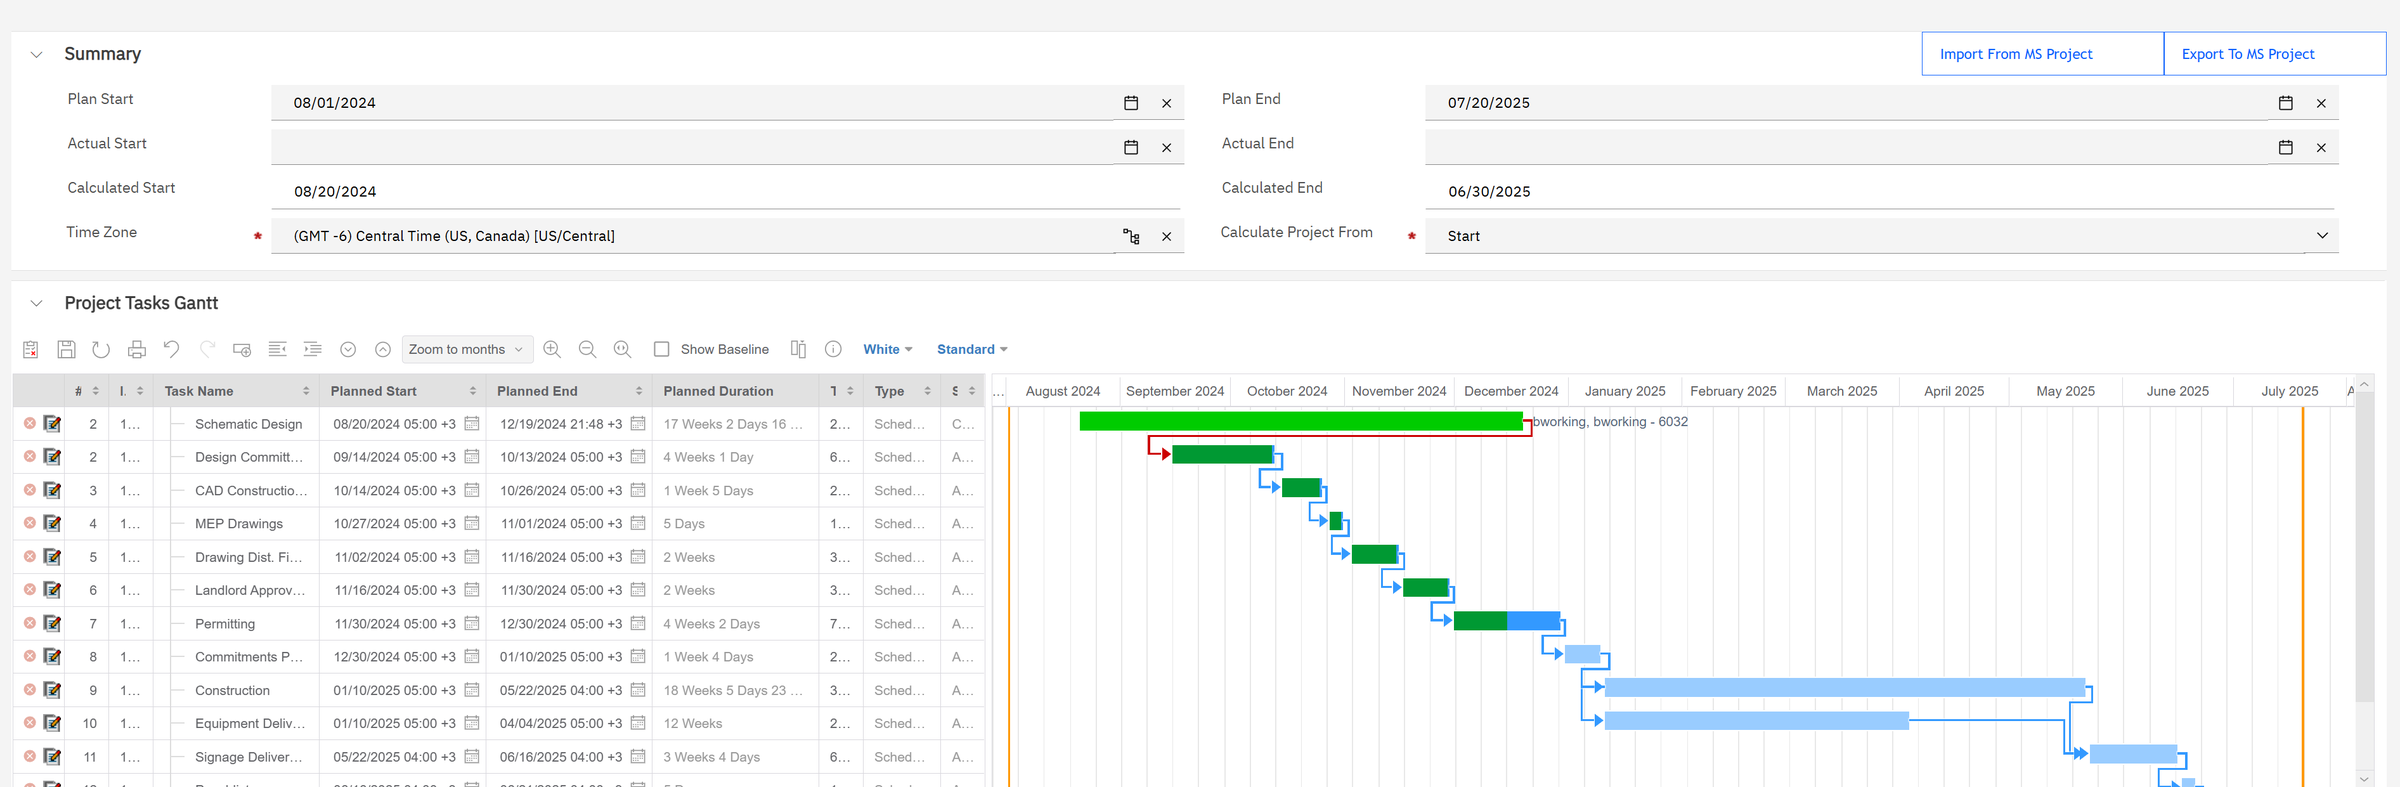
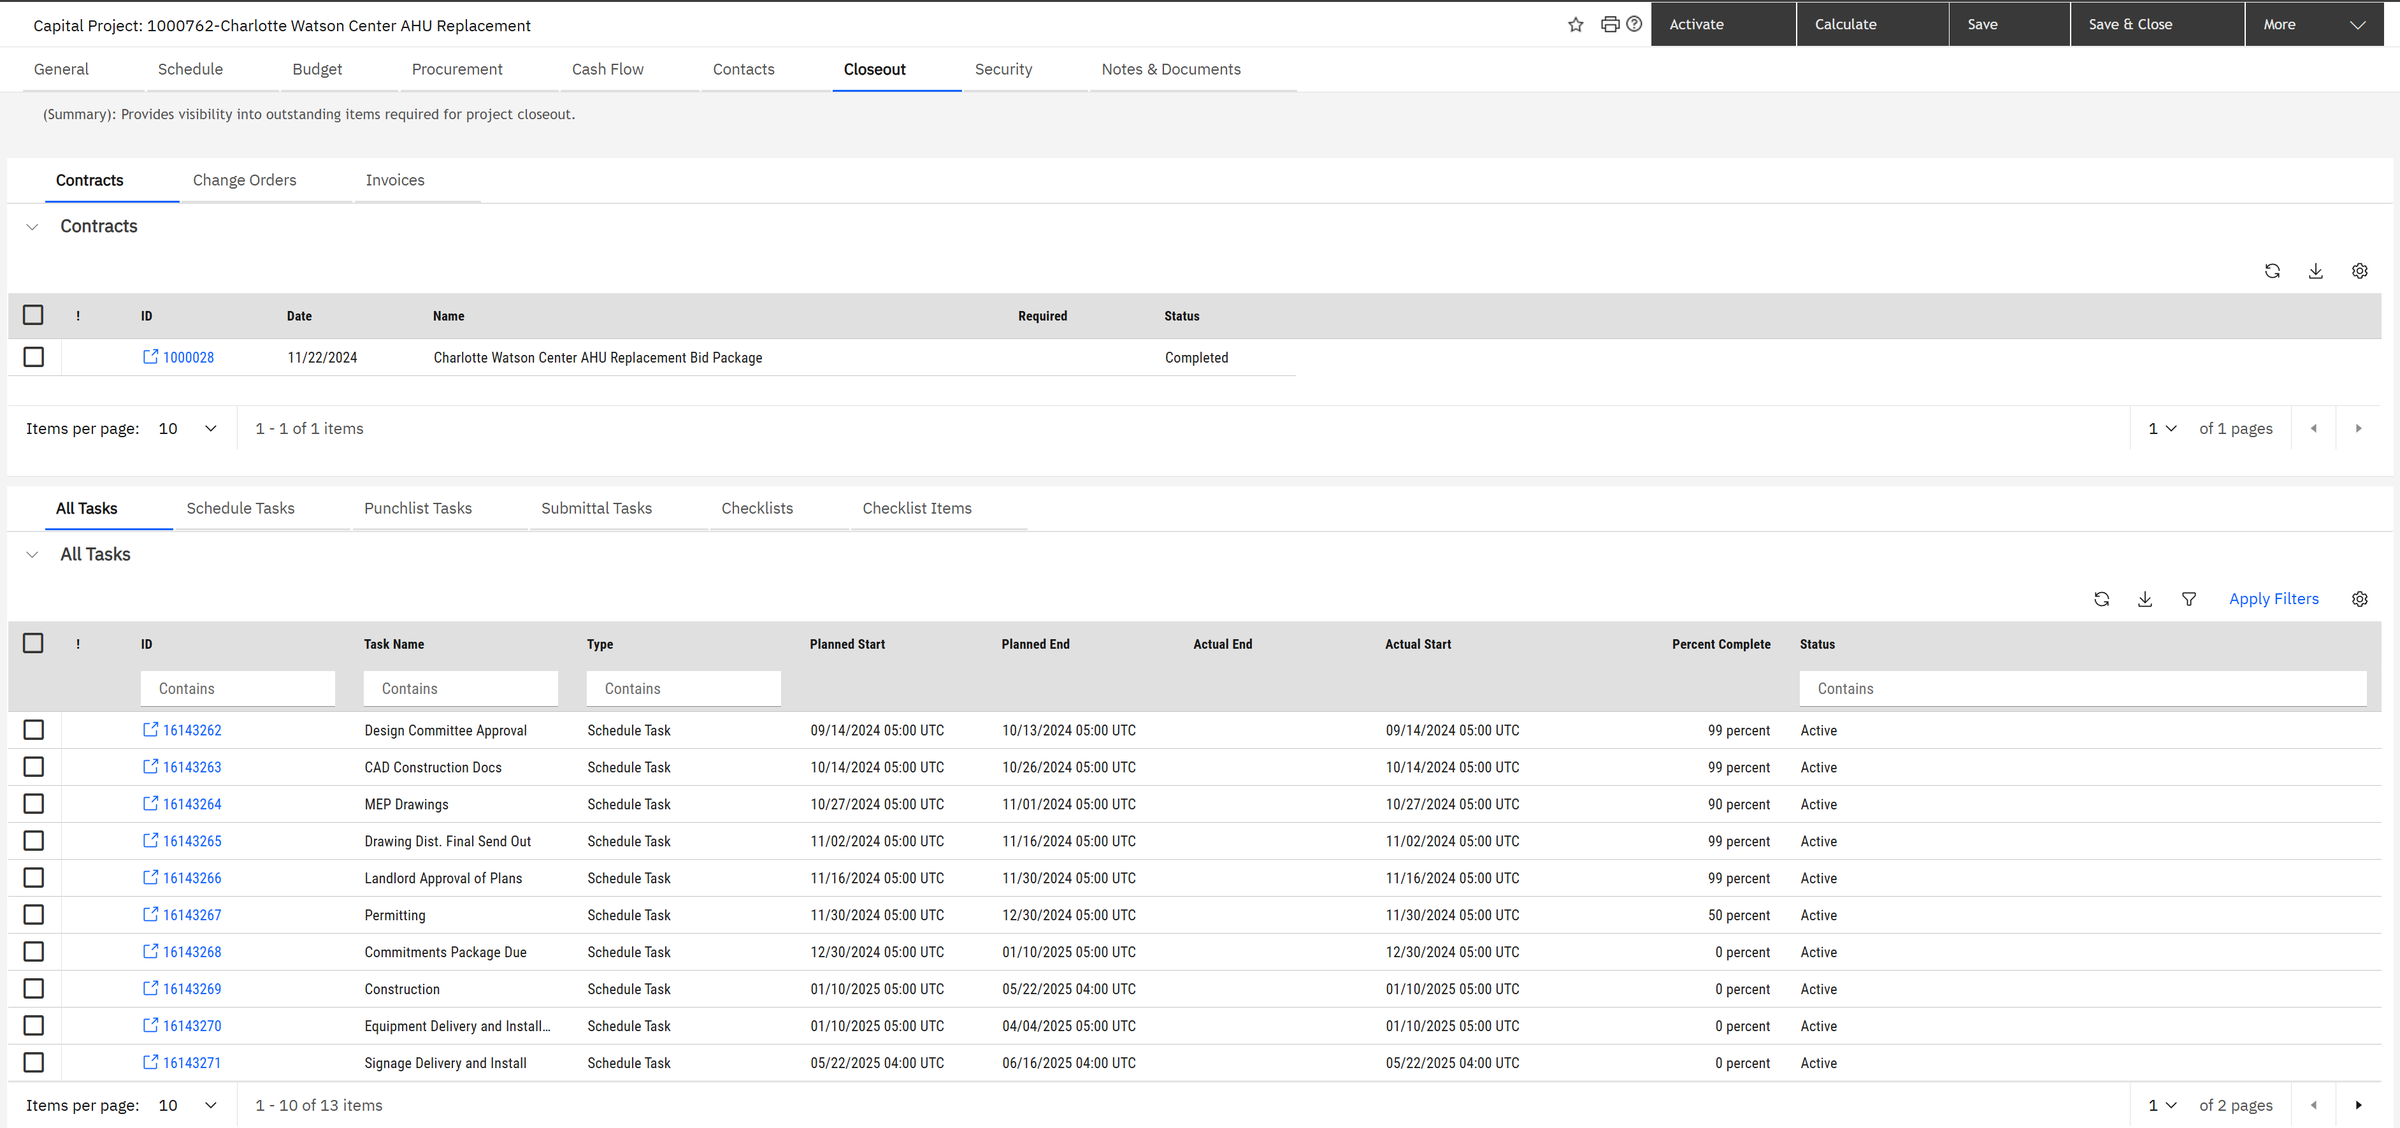
The schedule came from a template: 14 standard tasks from schematic design to construction, linked by dependencies (a task cannot start before the one it depends on ends). Design is complete, permitting is half done, construction comes next.
The Budget tab is where planning meets reality. It is the most important screen for a project manager, so let's read it carefully.
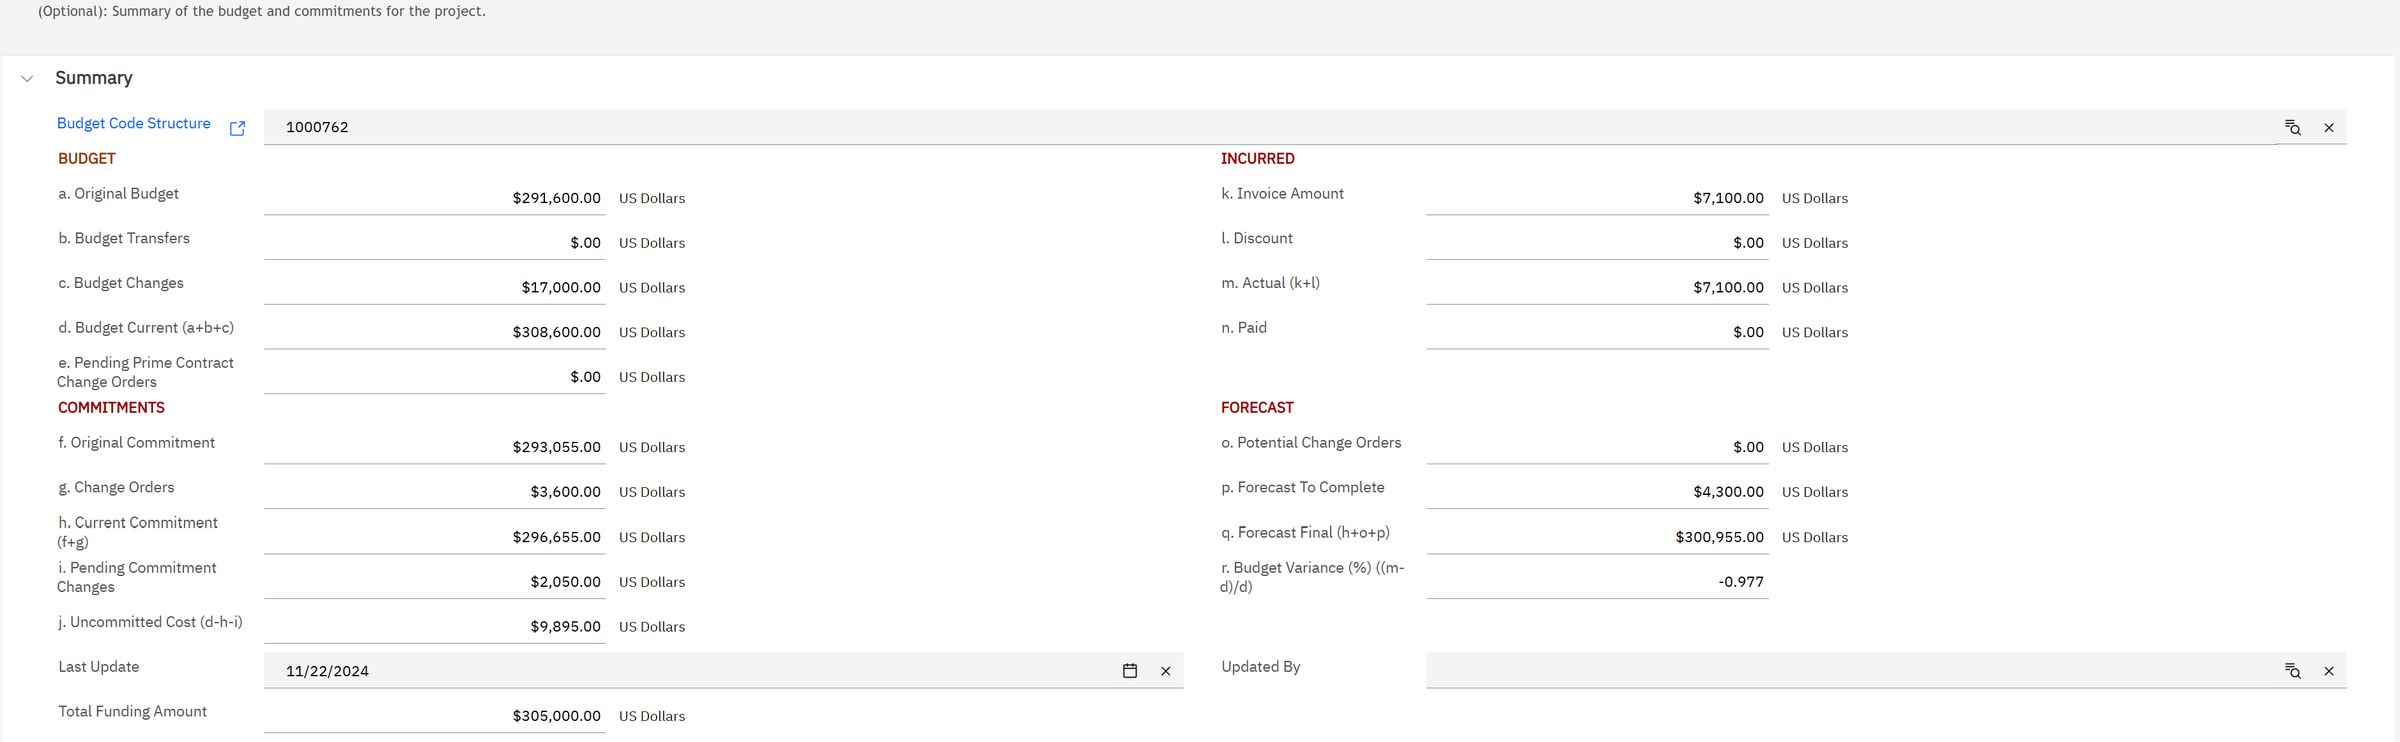
Budget: the money approved. Commitment: the money promised to suppliers by signed contracts and orders. Actual: the money already invoiced. Forecast: what the project is expected to cost in the end.
Current budget (d) = original $291,600 + transfers $0 + changes $17,000 = $308,600
Current commitment (h) = original $293,055 + change orders $3,600 = $296,655
Not yet committed (j) = 308,600 − 296,655 − pending $2,050 = $9,895
Forecast final (q) = 296,655 + potential changes $0 + still to come $4,300 = $300,955
Is the project on budget? Compare the forecast with the budget: $300,955 against $308,600 is $7,645 (2.5%) under. Careful with the "Budget Variance" field on this screen: it compares actual spend ($7,100) with the budget, so −0.977 means 97.7% of the budget is not spent yet, which is normal before construction starts.
The money is traceable to its source, year by year:
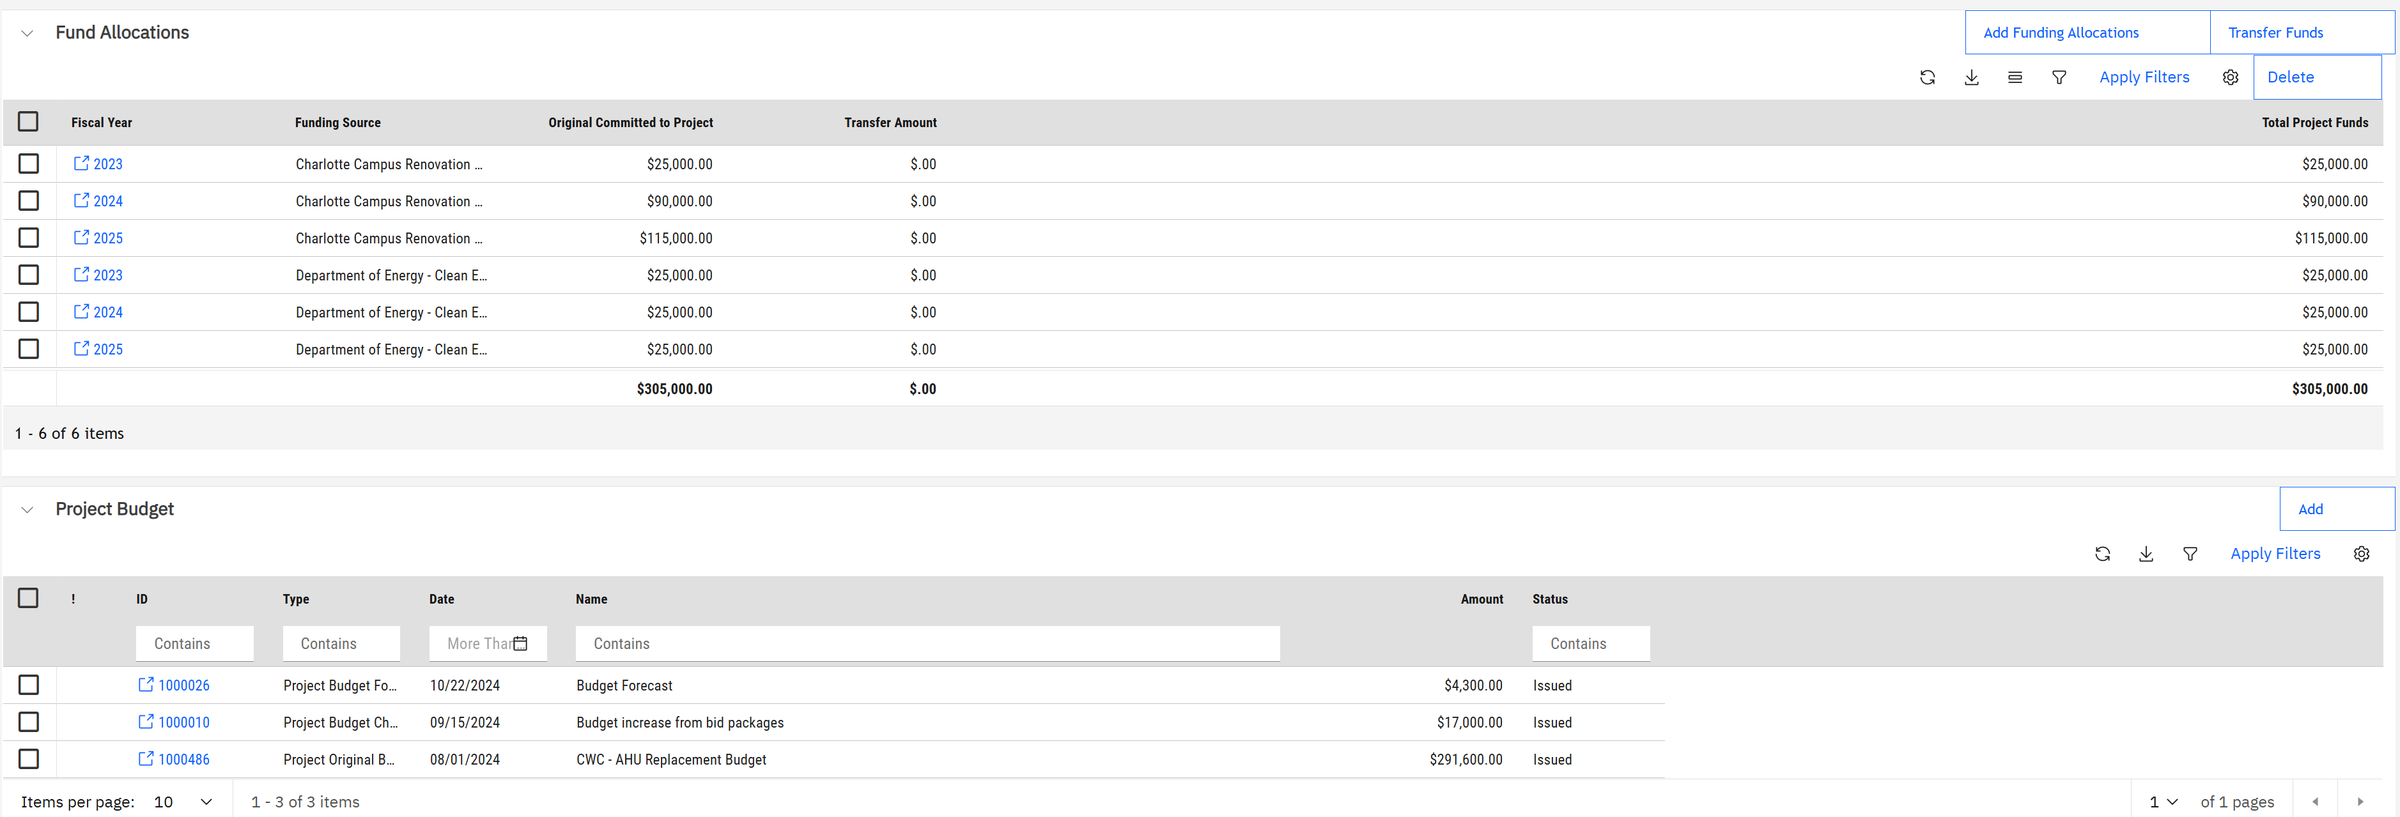
Campus program: $25,000 (2023) + $90,000 (2024) + $115,000 (2025) = $230,000
Department of Energy clean-energy grant: 3 × $25,000 = $75,000
Total funding $305,000, against a current budget of $308,600.
Then comes delivery. The Procurement tab holds the whole buying process: the bid document sent to contractors, the signed contract, change orders (official changes to a contract's scope or price, such as relocating an electrical junction box) and the contractor's invoices.
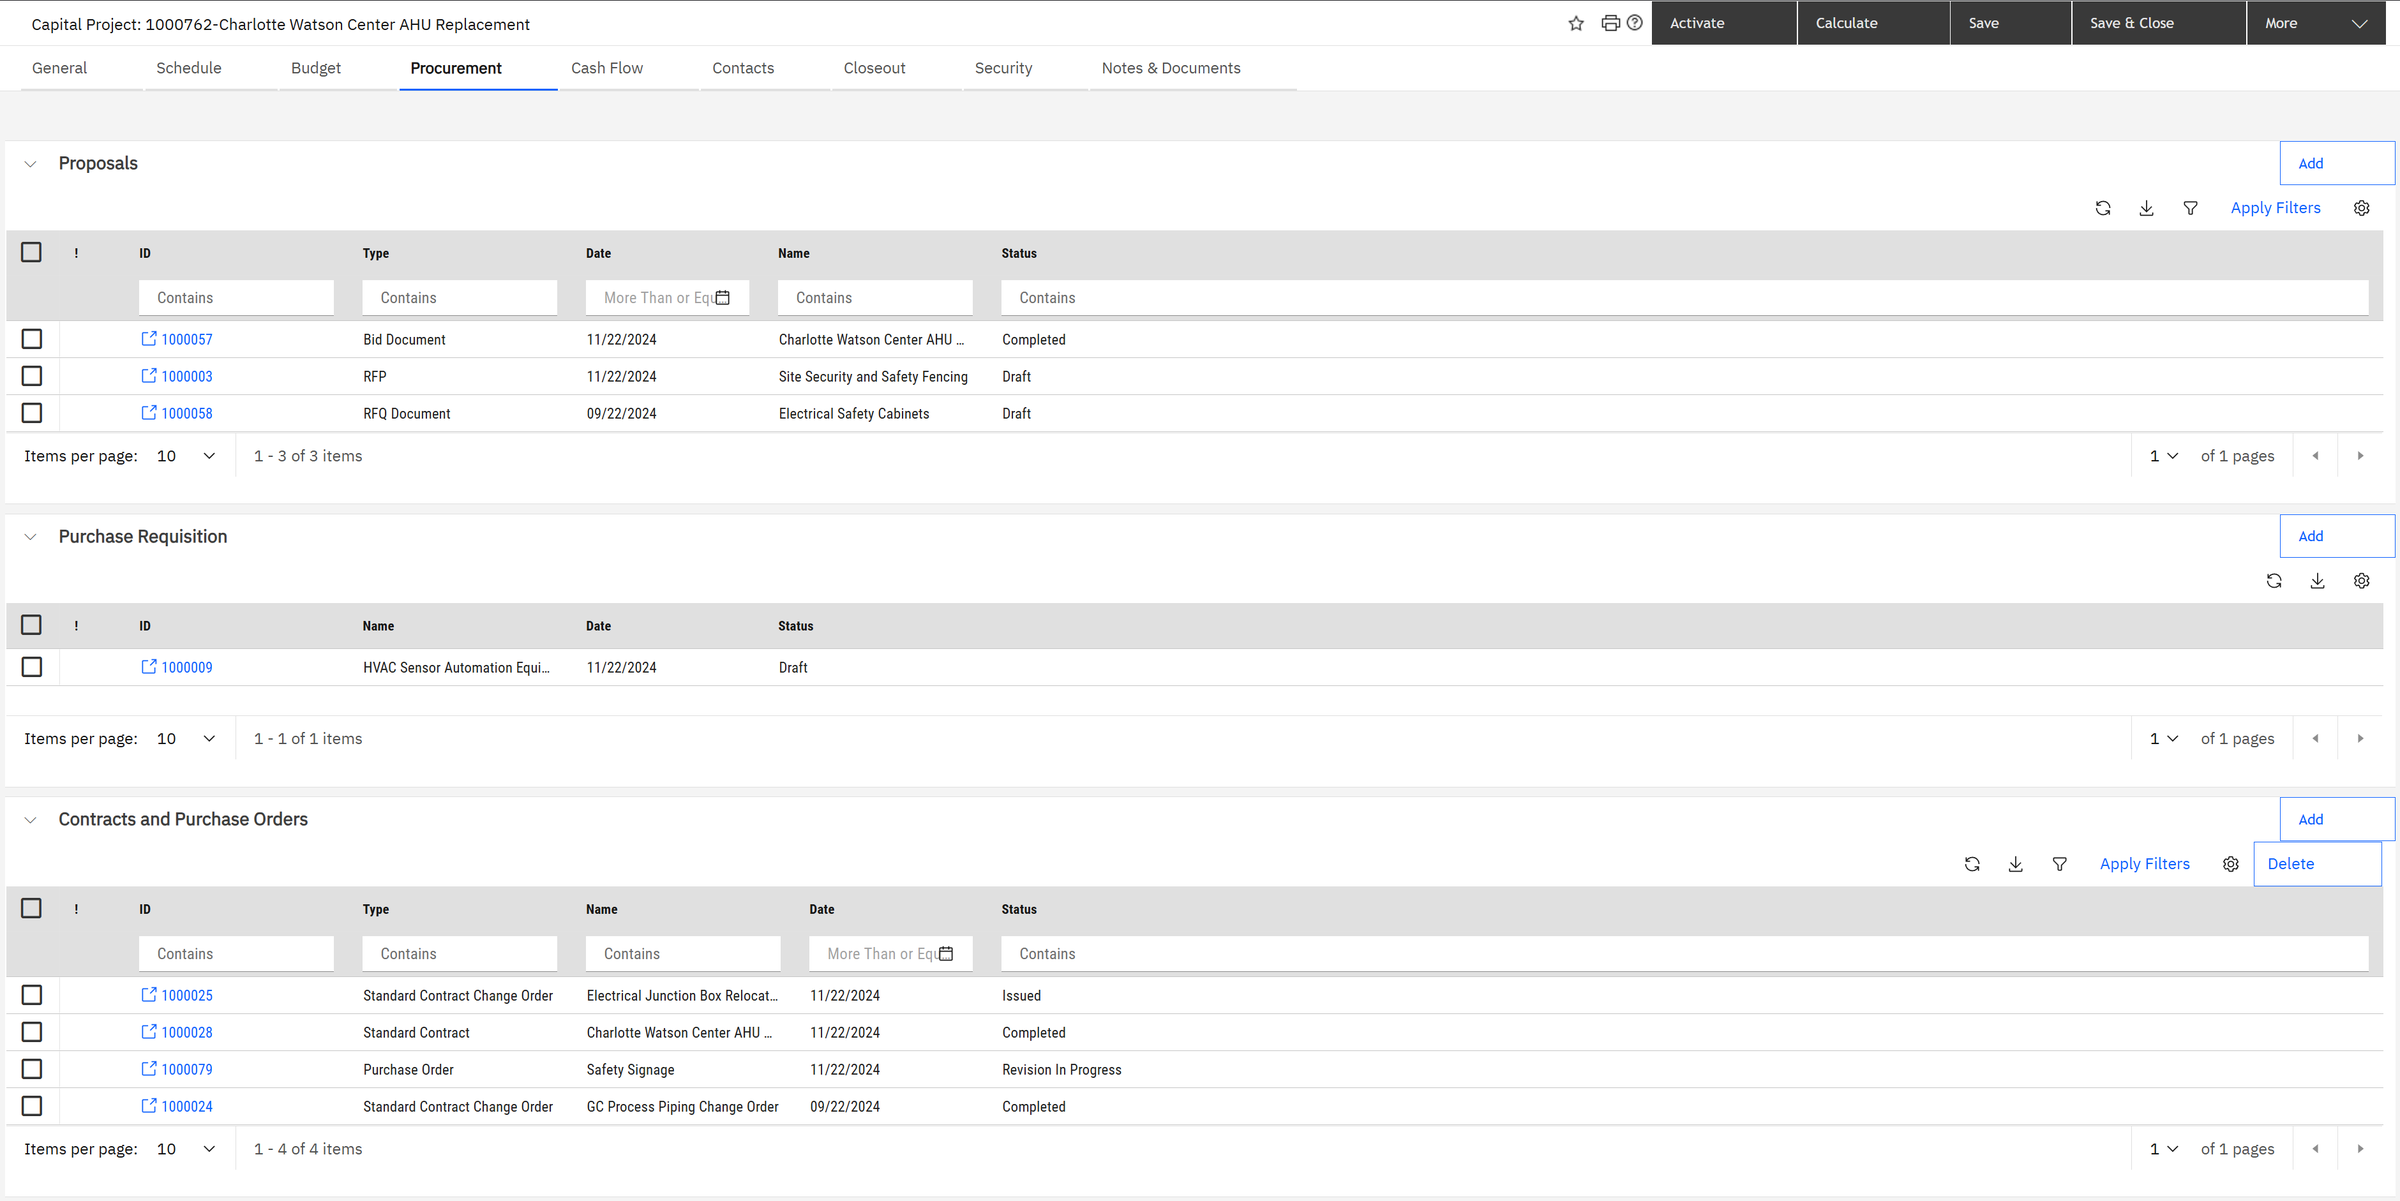
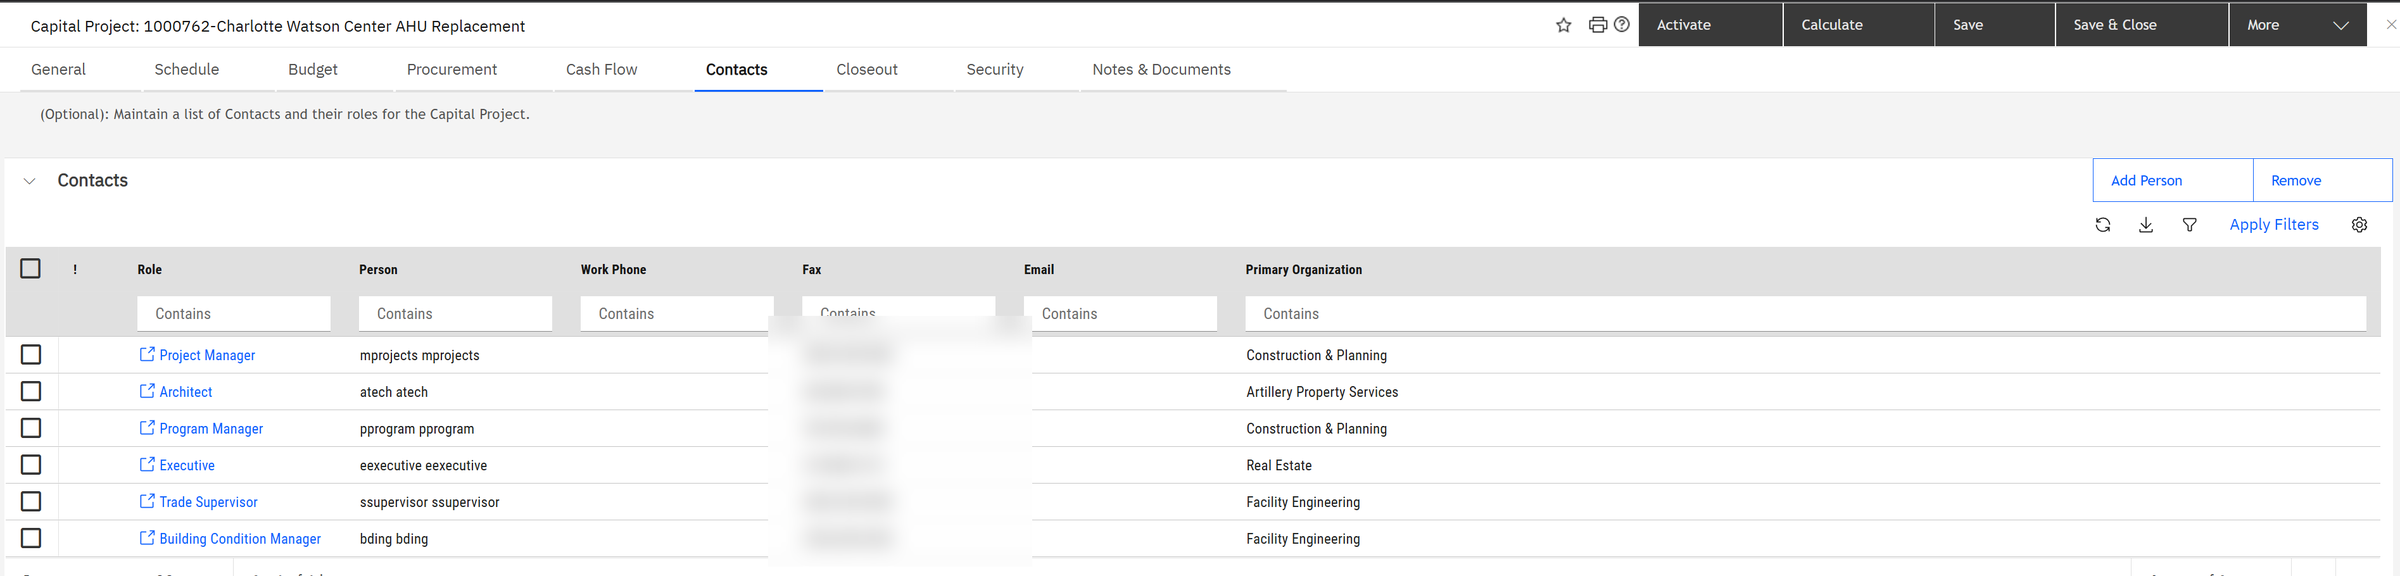
Look at the last line of the contacts. The building condition manager, the person whose dashboard started this story, is on the project team. The loop is closed: the need, the money and the delivery are on the same record, and the same people can follow it from end to end. Finally, Closeout lists everything that must be finished before the project can be closed: contracts, change orders, invoices and open tasks.
Common mistakes juniors make
- Starting from the requests, not the condition. The loudest request is not always the most urgent need.
- Forgetting the cost of waiting. With inflation and deterioration, a $1 million repair postponed three years can easily cost $1.2 million or more.
- Leaving savings empty. A request without savings looks like a pure cost (remember the −$800,000 NPV).
- Reading "actual vs budget" as "on budget". Early in a project, little is spent. Judge a project by its forecast against its budget.
- Losing the link. When the need, the request and the project live in different files, nobody can show why the money was spent.
Check yourself
1. A building costs $20 million to replace and has $3 million of needs. What is its FCI, and is it good, fair or poor?
3,000,000 ÷ 20,000,000 = 0.15: poor (above 0.10).
2. An energy project costs $120,000 and saves $30,000 a year. What is its simple payback?
120,000 ÷ 30,000 = 4 years. Its simple yearly ROI is 25%.
3. Why does the solar request show an NPV of −$800,000?
Because no savings or rebates were entered: MREF only sees the cost. The NPV equals minus the investment.
4. A program has a $10 million budget, $6 million allocated and $1 million of pending requests. How much is truly available?
10 − 6 − 1 = $3 million (line G on the Financials tab).
5. Is the AHU project on budget? Which two numbers do you compare?
Compare the forecast final ($300,955) with the current budget ($308,600): $7,645 under, so yes.
Glossary
- CAPEX / OPEX
- Capital expense (one-off, long-lasting) / operating expense (yearly running costs).
- Replacement value (CRV)
- What it would cost to rebuild the building today.
- FCI
- Facility Condition Index: needed repairs ÷ replacement value. Lower is better.
- UNIFORMAT
- Standard classification of building parts (B shell, C interiors, D services, E equipment).
- Opportunity
- A recorded, costed need to repair, replace or improve something.
- Backlog
- All known needs not yet done.
- Component renewal
- A part reaching the end of its expected life and due for replacement.
- Funding request
- A formal, comparable request for money for a piece of work.
- Funding source
- Where money comes from: a capital budget, a grant, a loan.
- Program
- A pot of money with a purpose and a time span, containing projects.
- Capital project
- One funded piece of capital work, with its schedule, budget and contracts.
- Commitment
- Money promised to suppliers by signed contracts and purchase orders.
- Change order
- An approved change to a contract's scope, price or time.
- Payback / ROI / NPV
- Years to recover an investment / yearly return in % / value created after discounting future savings.
Screens: IBM Maximo Real Estate and Facilities on IBM Maximo Application Suite, with IBM's GreenPoint demo data. All amounts, names and projects are demo values. Thresholds and formulas are those shown on the screens.