IBM Maximo Real Estate and Facilities · Reporting · A guide for Maximo people
Reporting in Maximo Real Estate and Facilities: one tool for lists, reports and charts
In Maximo you learned three things for reporting: saved queries, Ad Hoc reports and BIRT. In Maximo Real Estate and Facilities (MREF, the former TRIRIGA) almost everything is one thing: a report definition built in the Report Manager. The list on a portal, the table inside a form, the search screen, the grouped report and the bar chart are all the same object with a different Type. This guide opens one, then builds one from an empty form to a chart, on a live system.
- Where reports live: My Reports, Community, System Reports.
- The anatomy of a report: business object, columns, order and group, user filters, system filters, association filters.
- The report types and when each is used.
- Example 1: read an existing report, "Leases by Landlord".
- Example 2: build "Buildings by City" from scratch: 89 active buildings, grouped, with totals.
- Example 3: turn the same definition into a bar chart.
- Sharing, export and the Report Scheduler, and five traps.
Reading time: about 15 minutes. System: MREF on Maximo Application Suite 9.2, sample data.
| You know (Maximo Manage) | In MREF |
|---|---|
| Saved query on a List tab | A report of type Query, attached to a form, a portal or a navigation item |
| Ad Hoc report (QBR) | A report of type Report in My Reports |
| Result set or KPI on a Start Center | A report shown in a portal section; a Chart or Metric report for the graphic ones |
| Bind variable at run time ("request page") | A user filter: an empty box above the column |
| The fixed WHERE clause of a report | A system filter: the user cannot change it |
| Report object structure with child objects | Extra business objects added through an association |
| Report security by group | The Security tab of the report, plus Share Report |
| BIRT report scheduled by email | Report Scheduler |
| BIRT Designer for pixel-perfect output | BIRT also exists in MREF for form reports; not covered here |
1. The one idea: everything is a query
A report definition says: start from this business object, show these fields, keep these rows, sort and group like this. MREF then uses that one definition wherever a list of records is needed. This is why a default system carries thousands of them, and why the same builder serves a developer wiring a form and a planner who wants a list for Monday.
2. Where reports live
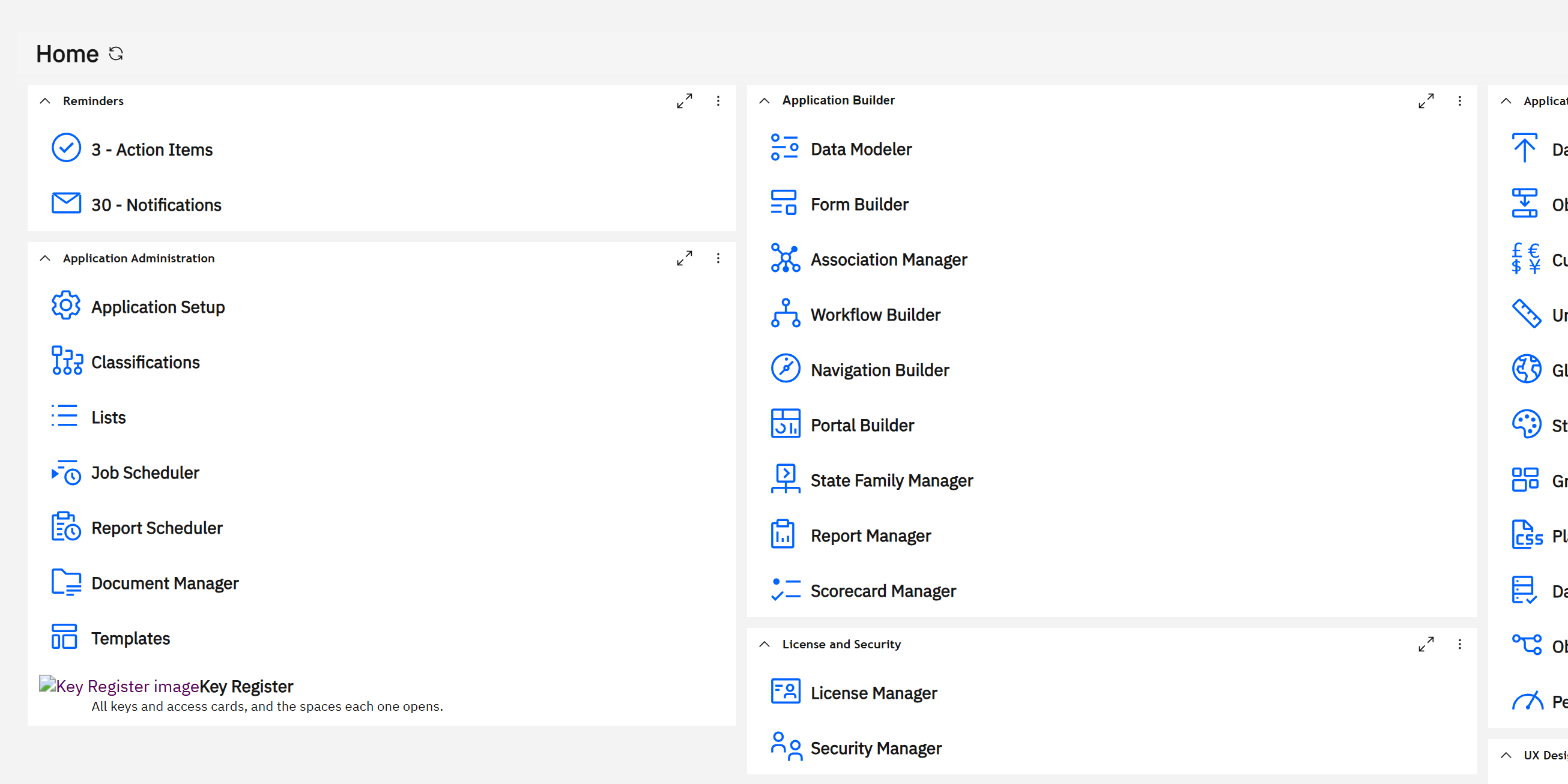
From the home page, open Report Manager (Tools › Builder Tools). Report Scheduler sits one column to the left.
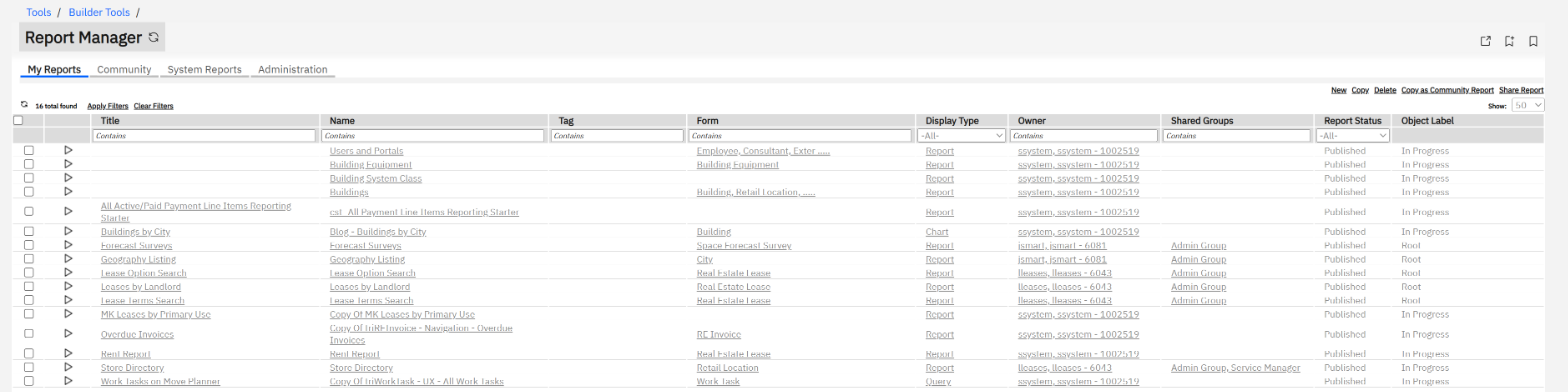
Report Manager has four tabs.
| Tab | What is in it | Who changes it |
|---|---|---|
| My Reports | Reports you own, and reports shared with your groups. 16 on our system. | You |
| Community | Reports published for everyone to copy from. | Authors who choose "Copy as Community Report" |
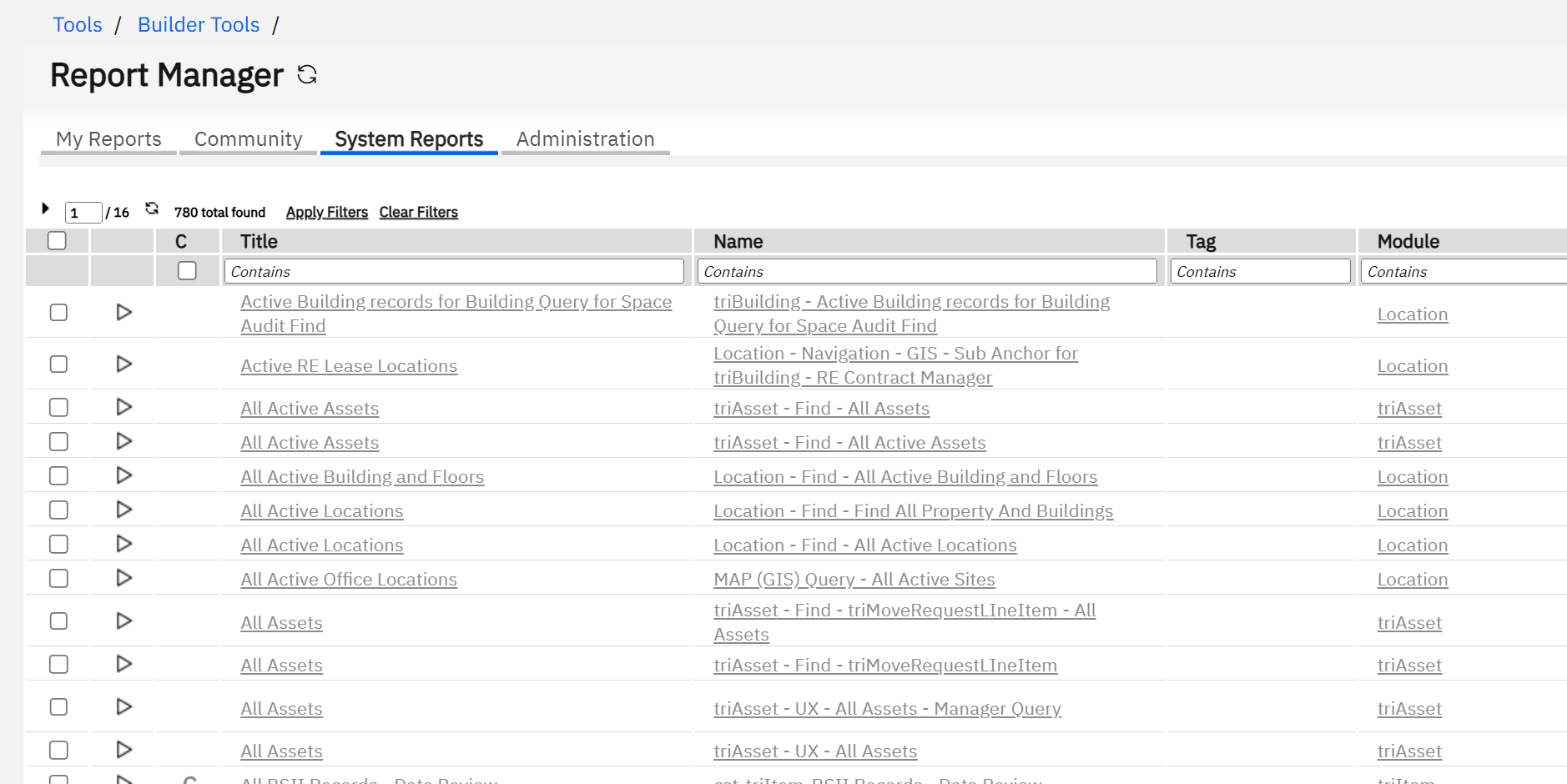
| System Reports | The definitions the application itself uses: every list, search and section query. Filtering on business objects that start with "triBuilding" alone returns 780. | Administrators and developers |
| Administration | Administrator functions. Not needed for this guide. | Administrators |
3. Example 1: run and read "Leases by Landlord"
Click the triangle next to Leases by Landlord.
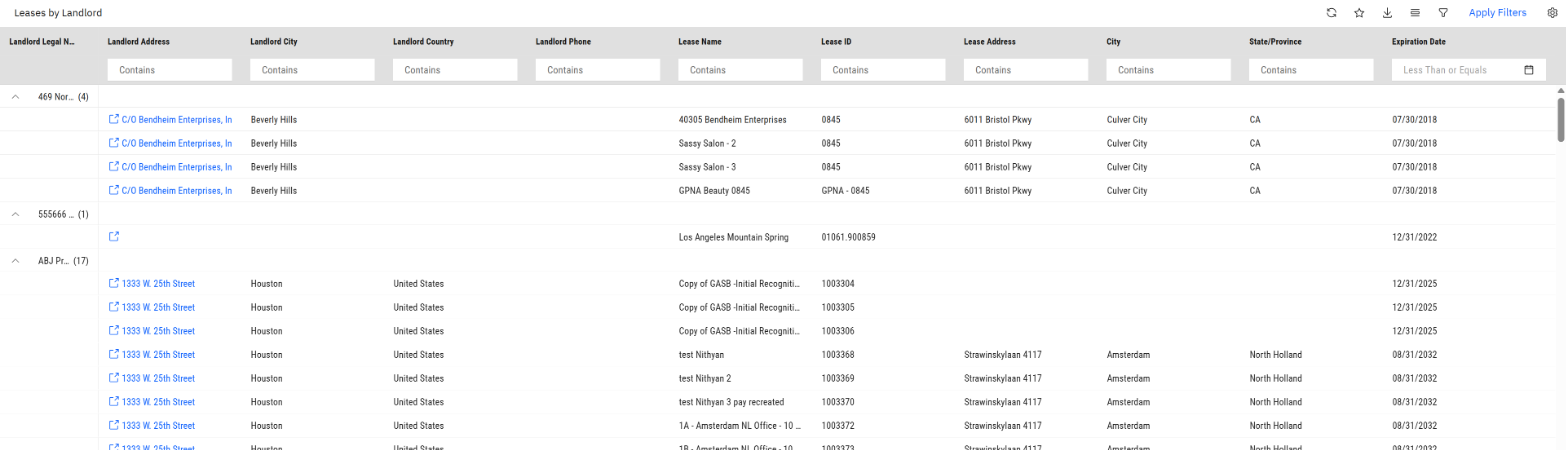
What the screen gives you without any design work:
- Groups you can collapse, with a count: "ABJ Pr… (17)".
- A filter box per column. Type and press Enter. Dates get "Less Than or Equals".
- A link to the record on the first column.
- A toolbar: refresh, add to bookmarks, export, row height, filters, settings.
4. The anatomy of a report
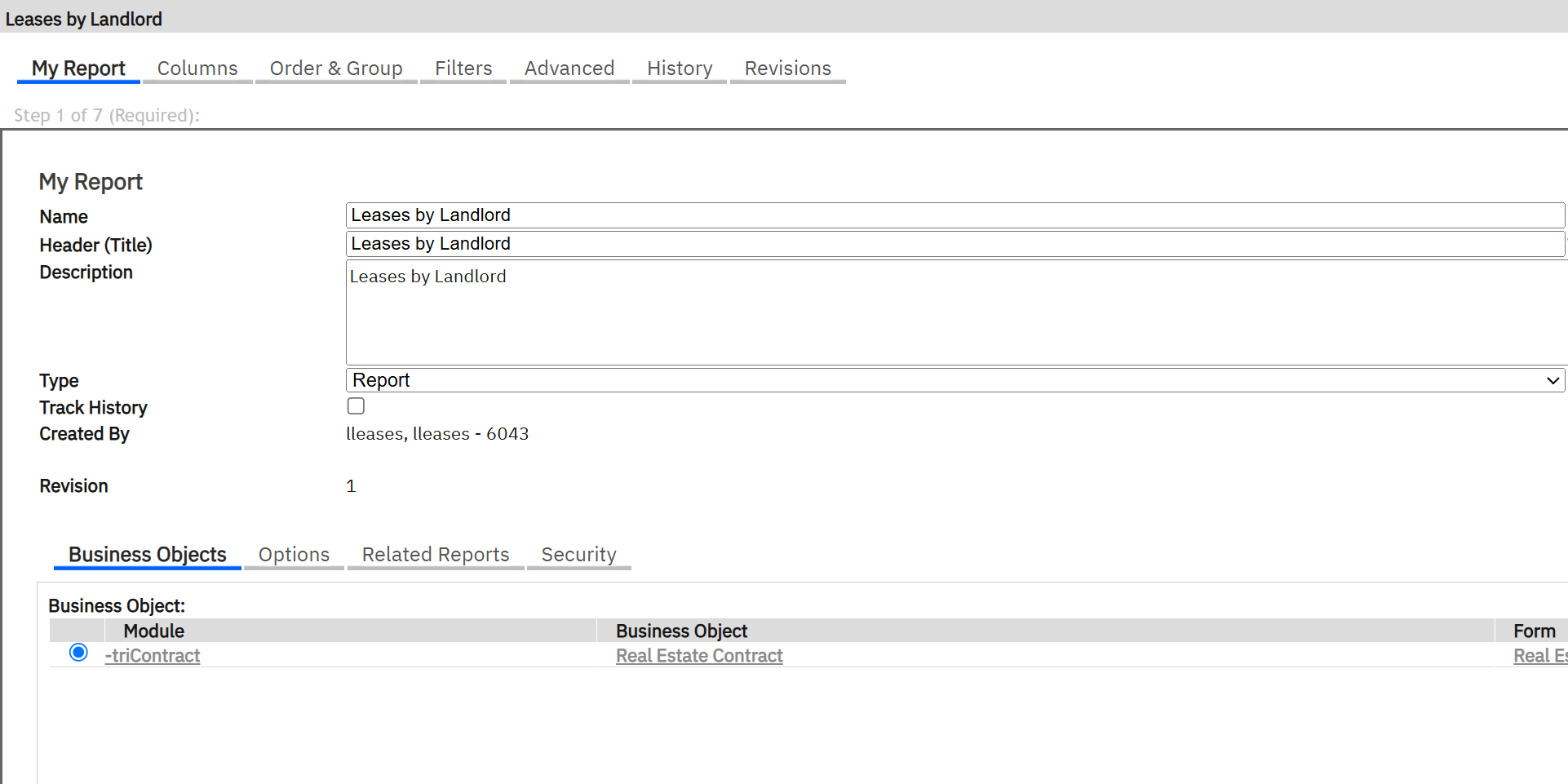
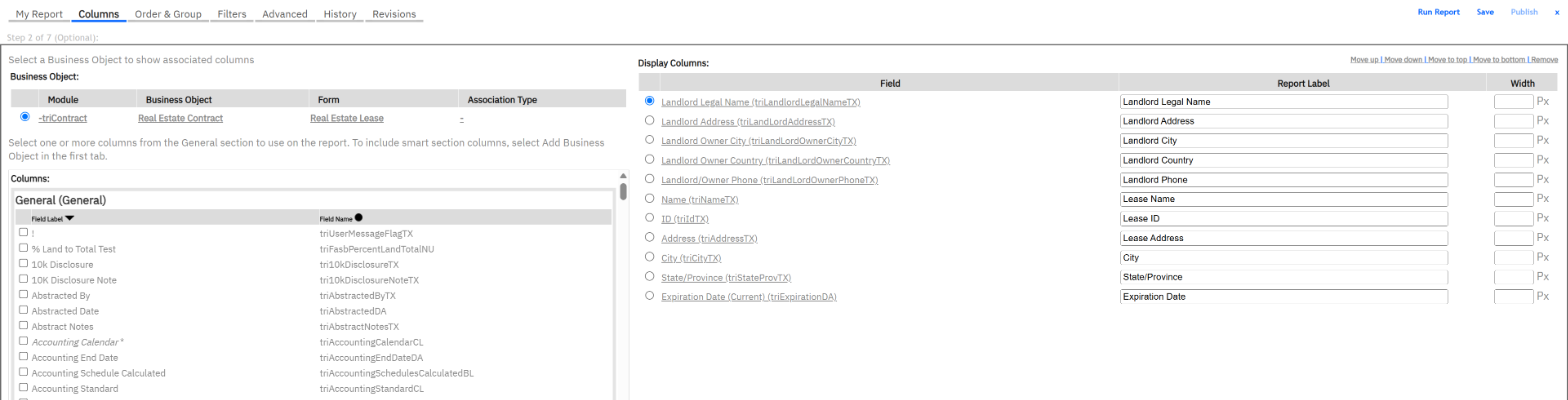
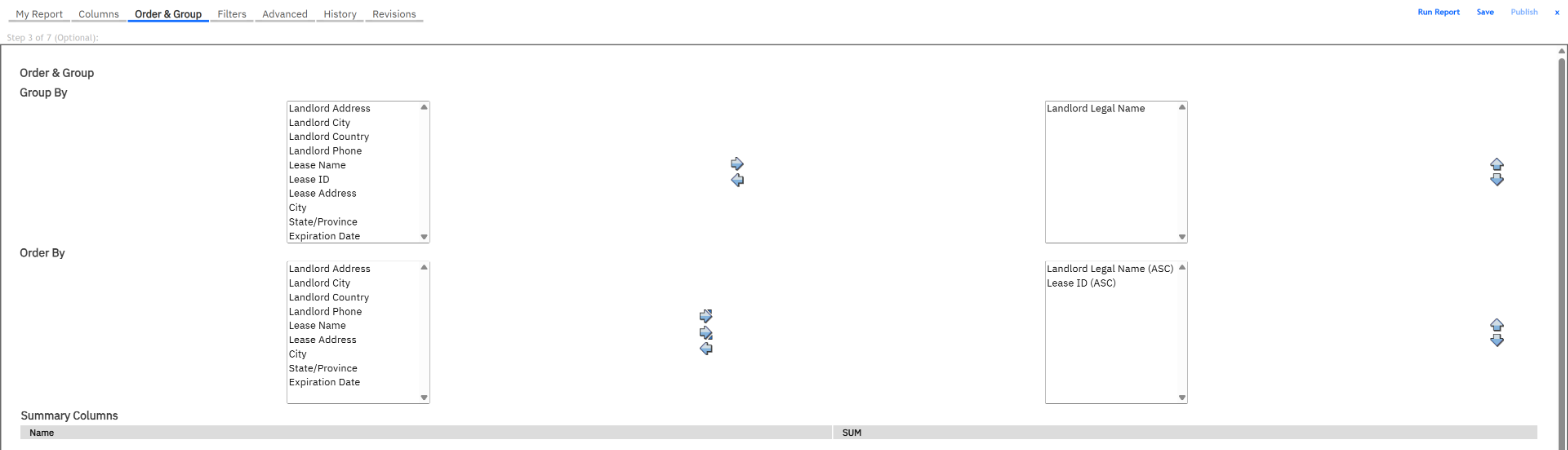
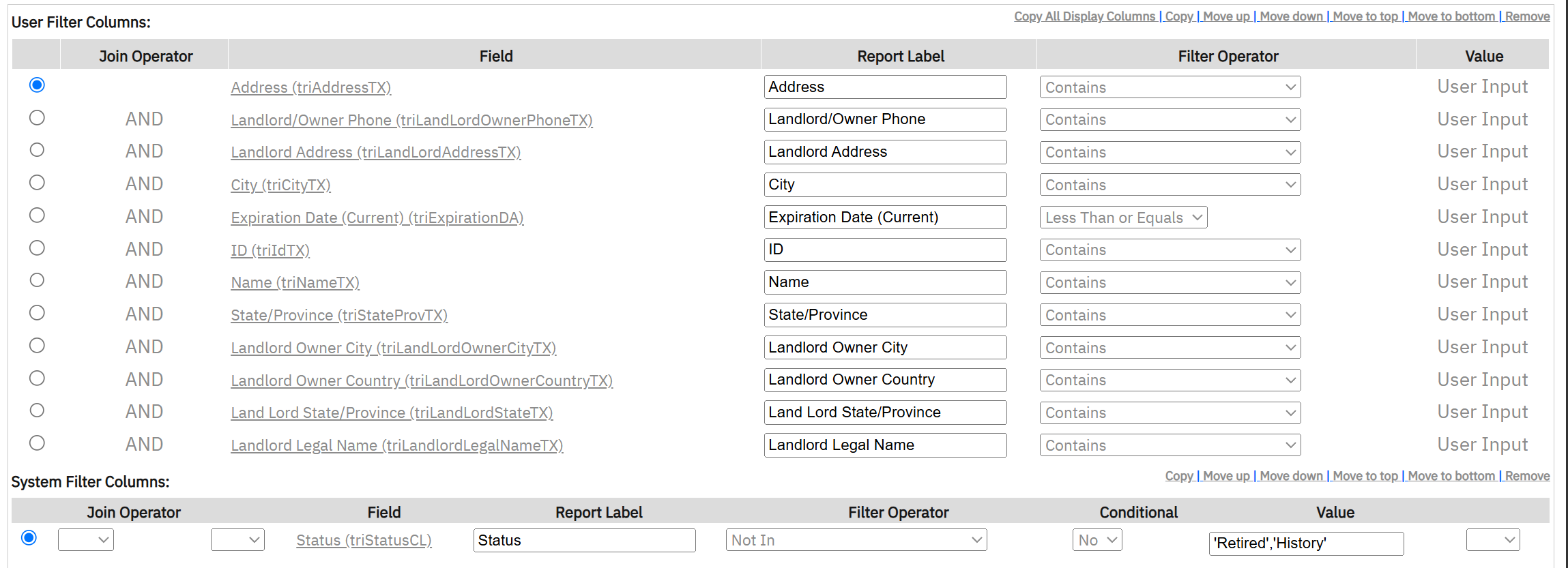
Click the report name instead of the triangle and the definition opens. It has seven tabs; you need five.
| Tab | Question it answers |
|---|---|
| My Report | What kind of record, and what type of output? |
| Columns | Which fields do I show? |
| Order & Group | In what order, grouped by what, with which totals? |
| Filters | Which rows always (system), and which can the user narrow (user)? |
| Advanced | Which rows by relationship: "only spaces of this building", "only my tasks". |
5. The report types
| Type | Output | Typical use |
|---|---|---|
| Query | A plain list. Created on the System Reports side; the builder in My Reports does not offer it, but a copied query keeps the type. | Sections in forms, search screens, lists behind a navigation item |
| Report | A list with grouping, totals and filters | Anything an end user runs from My Reports |
| Summary | Totals only, no detail rows | "Area by building", "cost by organisation" |
| Chart | Pie, bar, line or stacked bar | Portal sections for managers |
| Hierarchy | A tree | Locations, organisations, classifications |
| Metric | A measure against thresholds, from fact tables | Performance scorecards |
There is also Graphic, which colours a floor plan with report values. It needs CAD drawings and belongs in a space-planning guide.
6. Example 2: build "Buildings by City"
The question: which active buildings do we have in each city, how big are they, and how many people sit in them?
Step 1. New report, and its business object
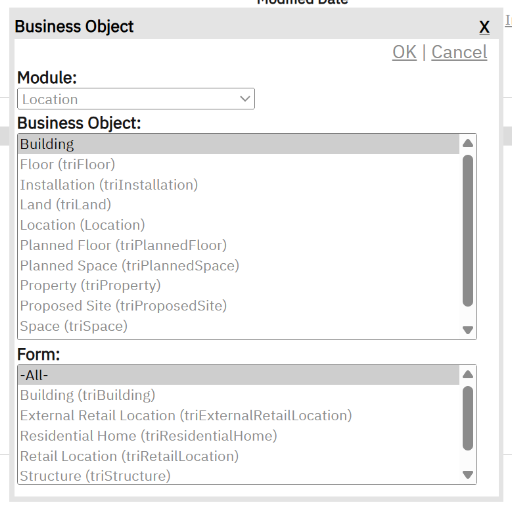
My Reports › New. Give it a name and a title, leave the type on Report, and choose Add Business Object. Pick the module, the business object and the form.
Step 2. Columns
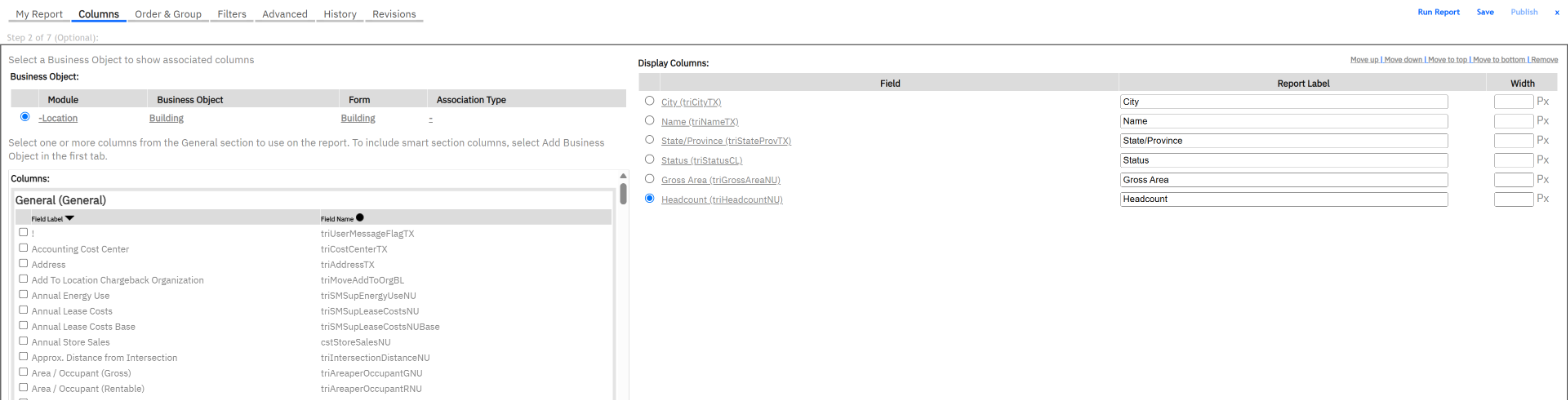
Tick City, Name, State/Province, Status, Gross Area and Headcount. The order you tick is the order of the columns; Move up and Move down fix it afterwards.
Step 3. Order, group and totals
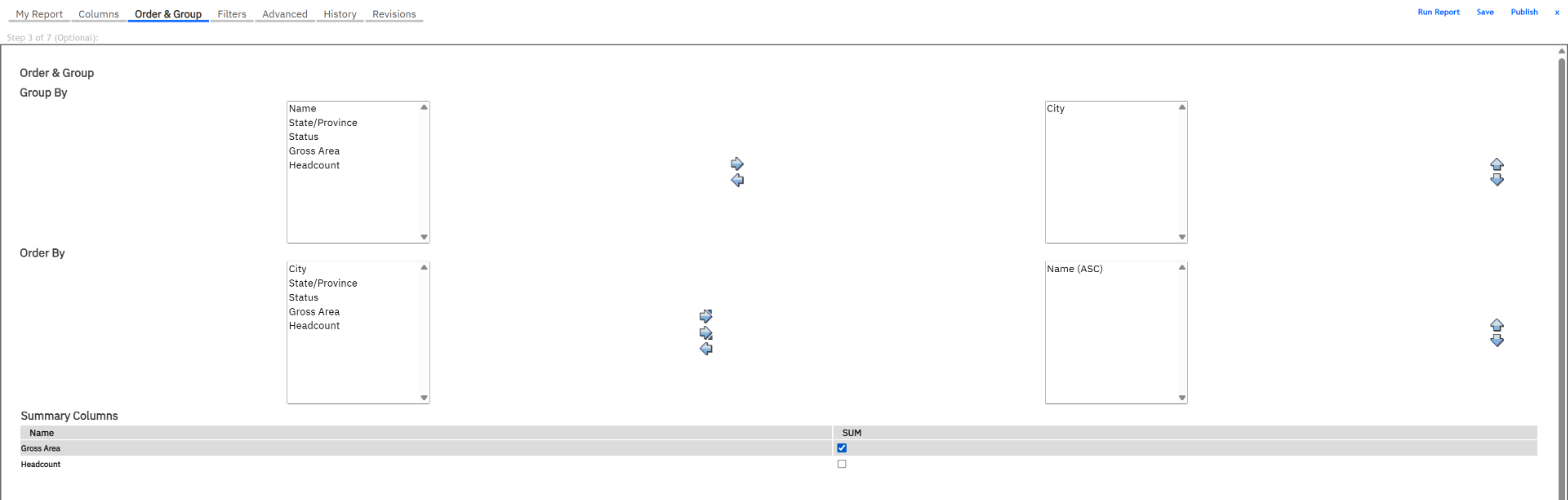
Group by City, order by Name, and tick SUM for the two number columns.
Step 4. Filters
In the field list each row now has two tick boxes: User and System. City and State/Province become user filters. Status becomes a system filter: Equals, Active.

Step 5. Save, Publish, Run
Save puts the report in "Work In Progress". Publish makes that revision the one that runs. Then Run Report.
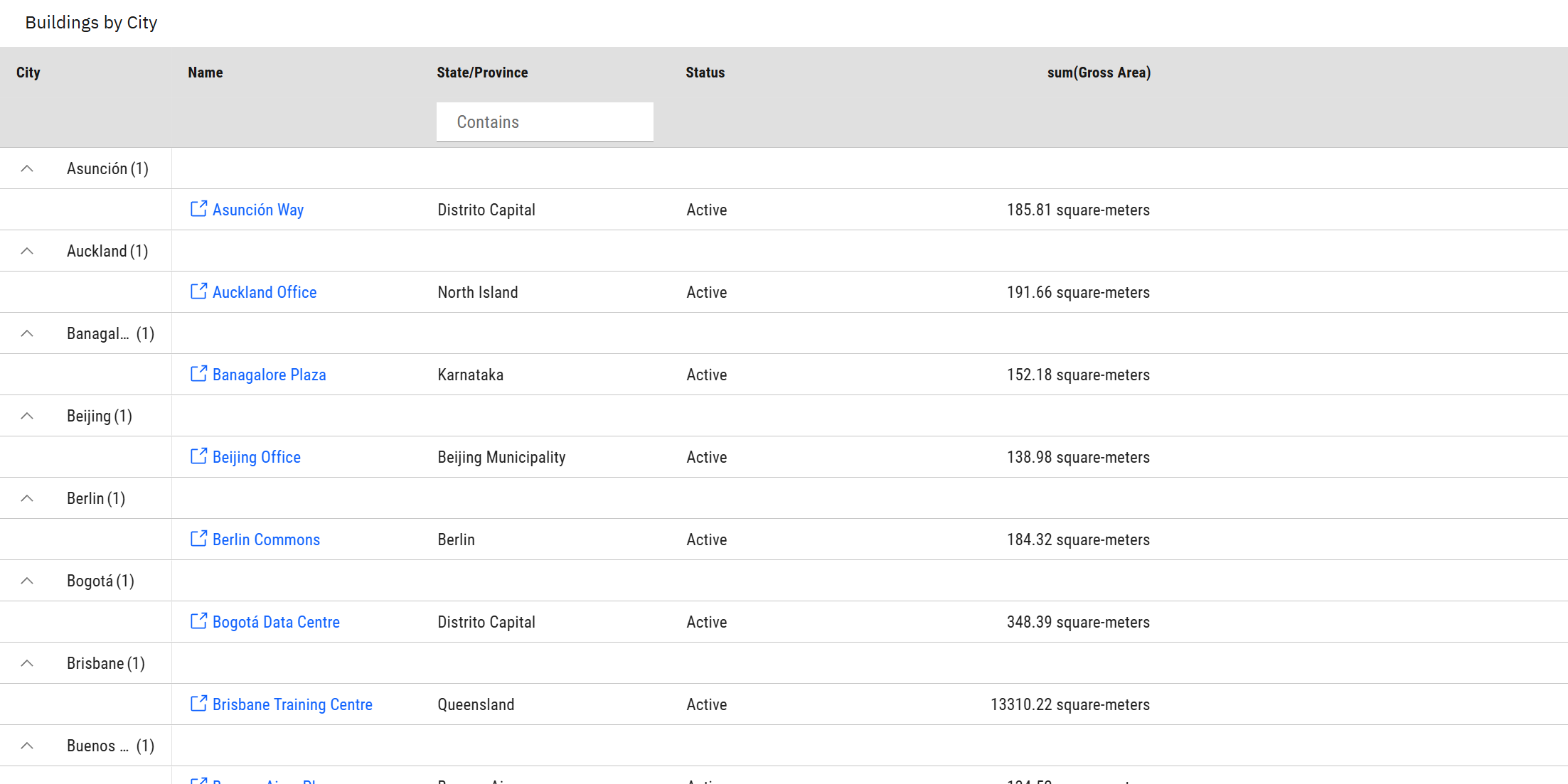
Type North Carolina in the State/Province box and press Enter:
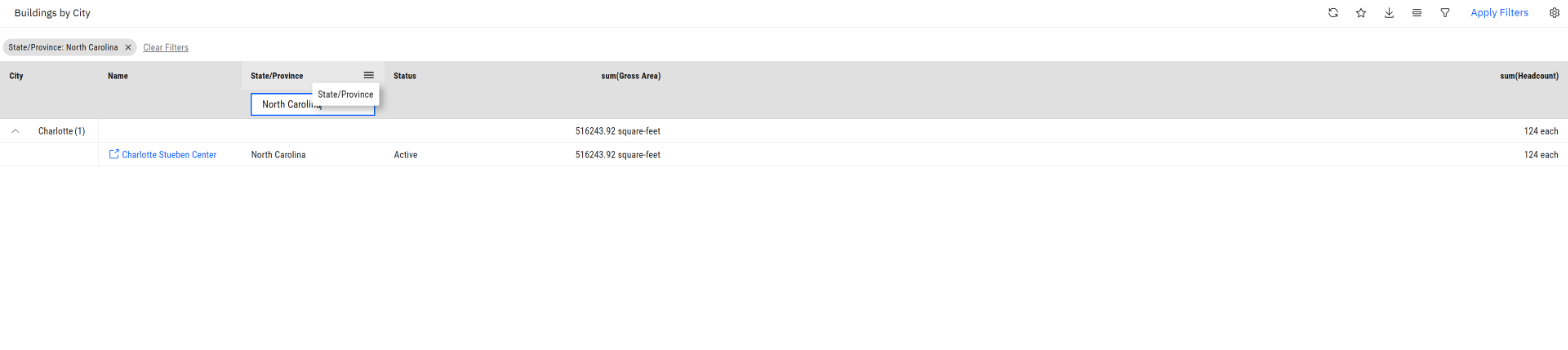
That is a working report in five steps and no code. The total headcount across the 89 buildings was 5,733.
7. Example 3: the same report as a chart
Open the definition again, change Type to Chart, and open the Options sub-tab. It now offers a graph type (Pie, Bar, Line, Stacked Bar), axis titles, a legend and a precision.
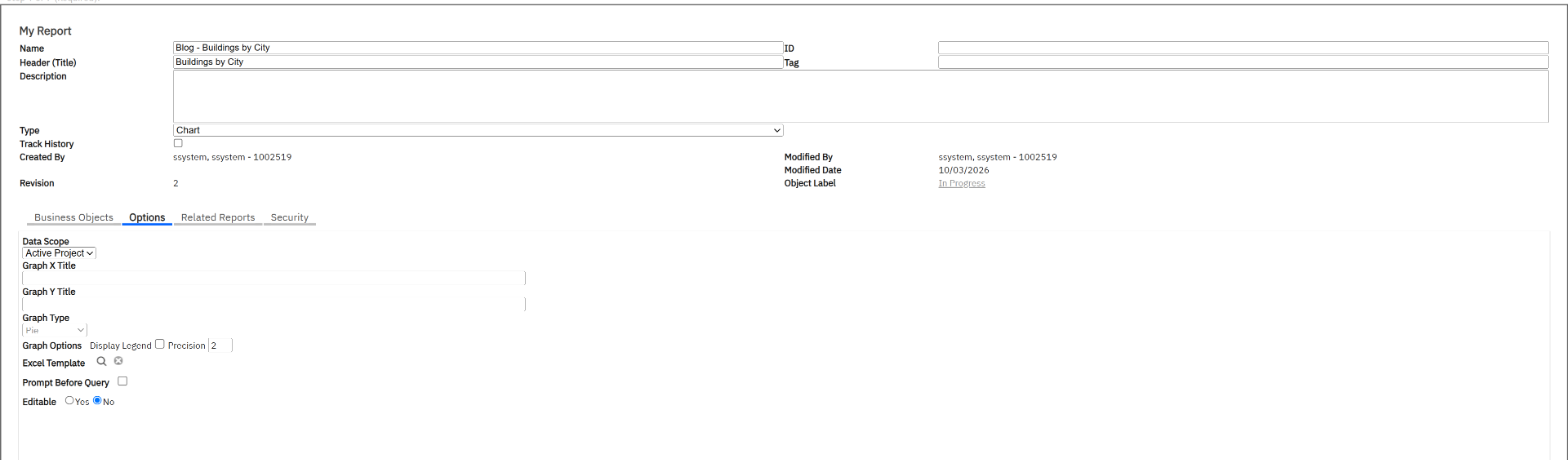
Graph type Bar, save, publish, run:
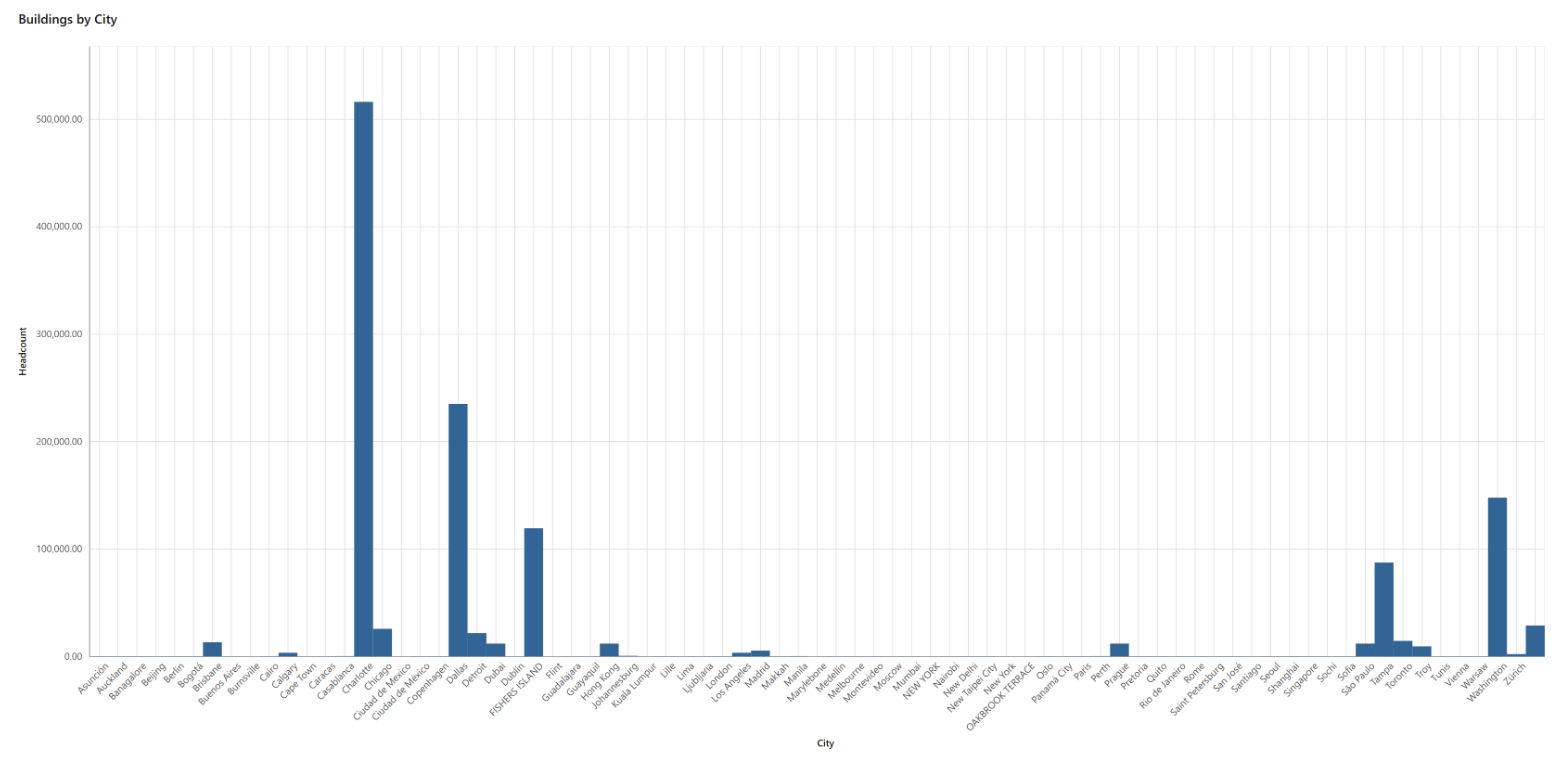
Look at the Y axis of my chart: it says "Headcount", and the bars are gross area. That is my mistake, kept on purpose. It shows two rules:
- A chart plots the group on X and the first summary column on Y. Gross Area came before Headcount, so Gross Area was drawn.
- The axis titles are free text. MREF does not check them against the data.
To chart headcount, remove the SUM on Gross Area or move Headcount above it, and re-publish.
8. Sharing, export and scheduling
| You want to | Do this |
|---|---|
| Let a group run your report | My Reports › tick the report › Share Report. The group appears in the Shared Groups column. |
| Offer it to everyone as a starting point | Copy as Community Report |
| Start from an application list | System Reports › tick it › Copy as My Report |
| Get the rows into Excel | The export icon on the report toolbar. It exports what is on screen, filters included. |
| Keep a favourite one click away | The star on the toolbar adds it to your bookmarks |
| Email it every Monday | Report Scheduler, on the home page next to Job Scheduler. Not shown in this guide. |
| Show it on a home page | Portal Builder: a portal section can take a report as its source. Not shown in this guide. |
9. Five traps
10. Check yourself
A user asks for "the building list, but only Europe". Which kind of filter?
If only this user wants it: a user filter on Country or a geography field, and they type the value. If nobody should ever see the rest: a system filter in a copy of the report shared with that group.
Your chart shows the wrong measure. Where do you look?
Order & Group › Summary Columns. The chart takes the first summary column. The axis title is only a label.
You changed a report and users see no difference. Why?
It was saved and not published; the status reads "Work In Progress".
Where is the list of rooms on the Building form defined?
In a System Report of type Query, with an association filter to the building. Find it in System Reports by business object, and copy it before changing anything.
Built on a demo system with sample data on 3 October 2026. The report "Blog - Buildings by City" was created for this article. Screens are from Maximo Real Estate and Facilities on MAS 9.2.